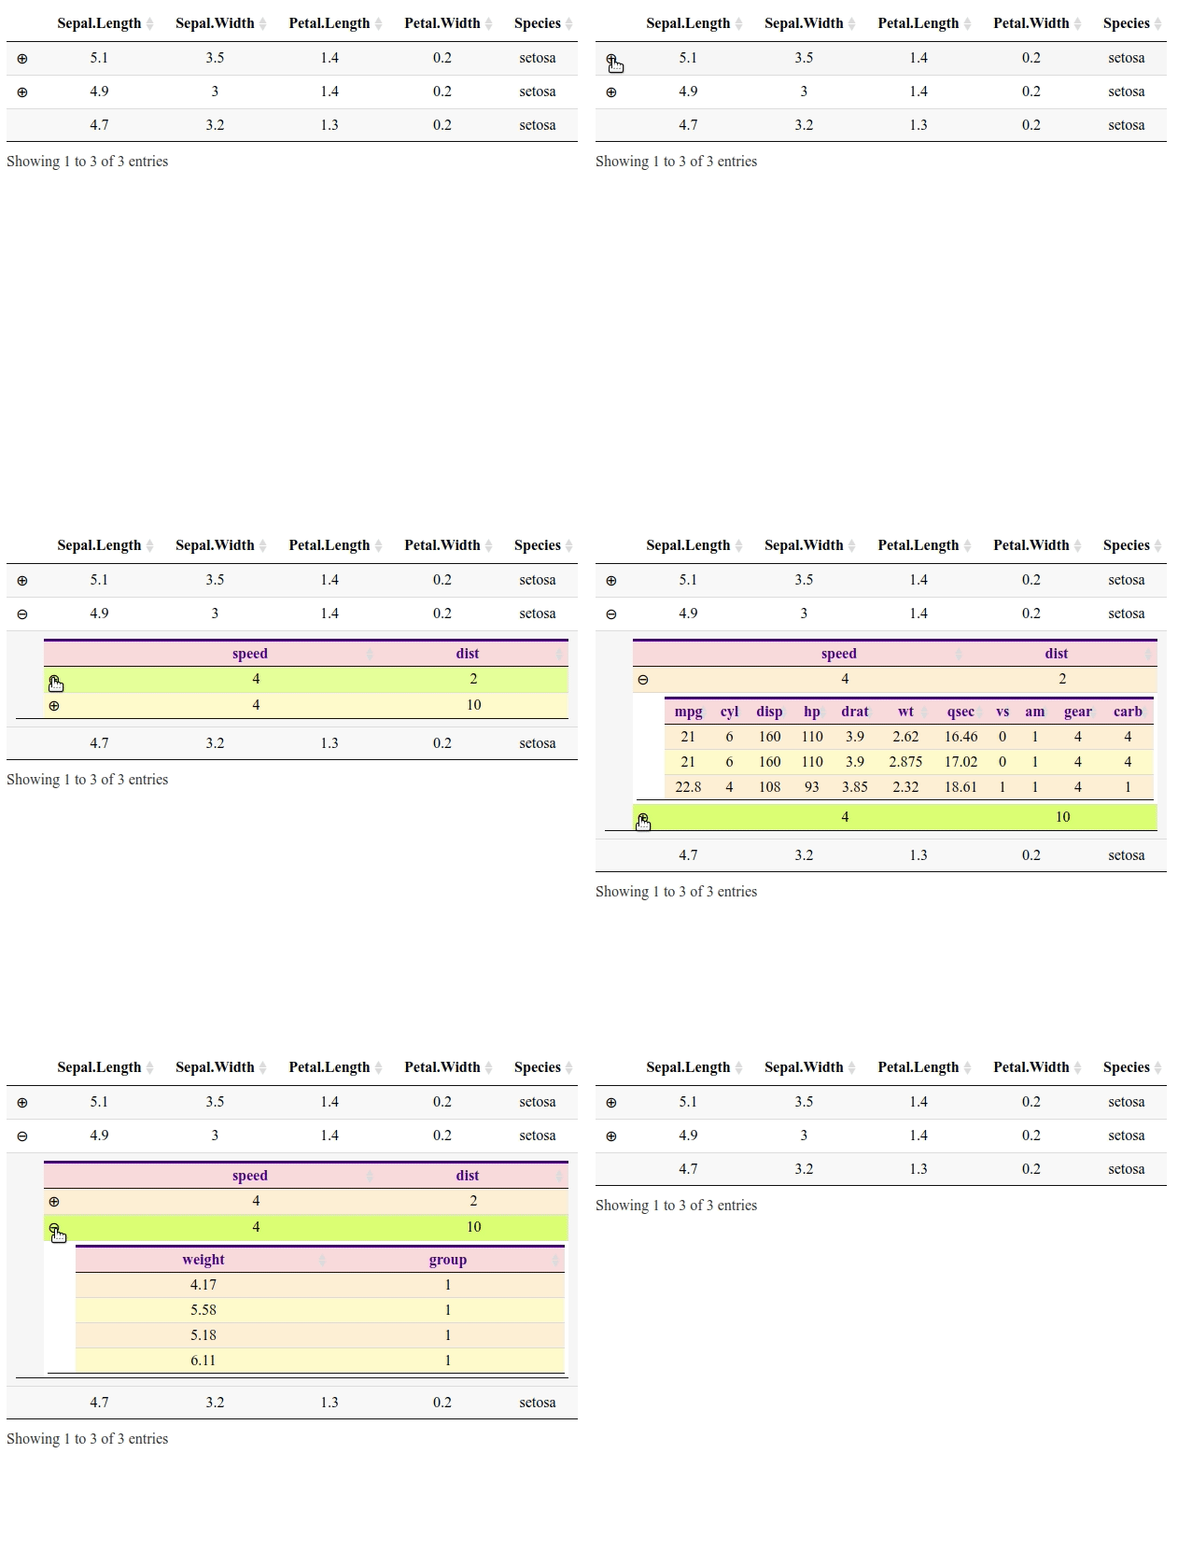
Child tables with DT, editing, exporting
I’m going to show how to use the DT package to do a table with child tables, and how to edit and export such a table.
In order to do a table with child tables, one adds a list column to the dataframe of the main table; each cell of this column contains the child table of the corresponding row, given as a list. This is done by the NestedData function below.
NestedData <- function(dat, children){
stopifnot(length(children) == nrow(dat))
g <- function(d){
if(is.data.frame(d)){
purrr::transpose(d)
}else{
purrr::transpose(NestedData(d[[1]], children = d$children))
}
}
subdats <- lapply(children, g)
oplus <- ifelse(lengths(subdats), "⊕", "")
cbind(" " = oplus, dat, "_details" = I(subdats),
stringsAsFactors = FALSE)
}The usage of NestedData is easy to understand with an example:
dat0   = iris[1:3,]        # main table, with three rows
dat01  = airquality[1:4,]  # |- child of first row
dat02  = cars[1:2,]        # |- child of second row, with two rows
dat021 = mtcars[1:3,]      # |  |- child of first row of dat02
dat022 = PlantGrowth[1:4,] # |  |- child of second row of dat02
dat03  = data.frame(NULL)  # |- third row has no child

Dat <- NestedData(
  dat = dat0,
  children = list(
    dat01,
    list(
      dat02,
      children = list(
        dat021,
        dat022
      )
    ),
    dat03
  )
)
Now we define the JavaScript callback which will be used. The code depends on whether one wants to display the row names of the main table, so the user has to enter this information before.
library(DT)
## whether to show row names
rowNames = FALSE
colIdx <- as.integer(rowNames)
## the callback
parentRows <- which(Dat[,1] != "")
callback <- JS(
sprintf("var parentRows = [%s];", toString(parentRows-1)),
sprintf("var j0 = %d;", colIdx),
"var nrows = table.rows().count();",
"for(let i = 0; i < nrows; ++i){",
" var $cell = table.cell(i,j0).nodes().to$();",
" if(parentRows.indexOf(i) > -1){",
" $cell.css({cursor: 'pointer'});",
" }else{",
" $cell.removeClass('details-control');",
" }",
"}",
"",
"// --- make the table header of the nested table --- //",
"var formatHeader = function(d, childId){",
" if(d !== null){",
" var html = ",
" '<table class=\"display compact hover\" ' + ",
" 'style=\"padding-left: 30px;\" id=\"' + childId + ",
" '\"><thead><tr>';",
" var data = d[d.length-1] || d._details;",
" for(let key in data[0]){",
" html += '<th>' + key + '</th>';",
" }",
" html += '</tr></thead></table>'",
" return html;",
" } else {",
" return '';",
" }",
"};",
"",
"// --- row callback to style rows of child tables --- //",
"var rowCallback = function(row, dat, displayNum, index){",
" if($(row).hasClass('odd')){",
" $(row).css('background-color', 'papayawhip');",
" $(row).hover(function(){",
" $(this).css('background-color', '#E6FF99');",
" }, function(){",
" $(this).css('background-color', 'papayawhip');",
" });",
" } else {",
" $(row).css('background-color', 'lemonchiffon');",
" $(row).hover(function(){",
" $(this).css('background-color', '#DDFF75');",
" }, function(){",
" $(this).css('background-color', 'lemonchiffon');",
" });",
" }",
"};",
"",
"// --- header callback to style header of child tables --- //",
"var headerCallback = function(thead, data, start, end, display){",
" $('th', thead).css({",
" 'border-top': '3px solid indigo',",
" 'color': 'indigo',",
" 'background-color': '#fadadd'",
" });",
"};",
"",
"// --- make the datatable --- //",
"var formatDatatable = function(d, childId){",
" var data = d[d.length-1] || d._details;",
" var colNames = Object.keys(data[0]);",
" var columns = colNames.map(function(x){",
" return {data: x.replace(/\\./g, '\\\\\\.'), title: x};",
" });",
" var id = 'table#' + childId;",
" if(colNames.indexOf('_details') === -1){",
" var subtable = $(id).DataTable({",
" 'data': data,",
" 'columns': columns,",
" 'autoWidth': true,",
" 'deferRender': true,",
" 'info': false,",
" 'lengthChange': false,",
" 'ordering': data.length > 1,",
" 'order': [],",
" 'paging': false,",
" 'scrollX': false,",
" 'scrollY': false,",
" 'searching': false,",
" 'sortClasses': false,",
" 'rowCallback': rowCallback,",
" 'headerCallback': headerCallback,",
" 'columnDefs': [{targets: '_all', className: 'dt-center'}]",
" });",
" } else {",
" var subtable = $(id).DataTable({",
" 'data': data,",
" 'columns': columns,",
" 'autoWidth': true,",
" 'deferRender': true,",
" 'info': false,",
" 'lengthChange': false,",
" 'ordering': data.length > 1,",
" 'order': [],",
" 'paging': false,",
" 'scrollX': false,",
" 'scrollY': false,",
" 'searching': false,",
" 'sortClasses': false,",
" 'rowCallback': rowCallback,",
" 'headerCallback': headerCallback,",
" 'columnDefs': [",
" {targets: -1, visible: false},",
" {targets: 0, orderable: false, className: 'details-control'},",
" {targets: '_all', className: 'dt-center'}",
" ]",
" }).column(0).nodes().to$().css({cursor: 'pointer'});",
" }",
"};",
"",
"// --- display the child table on click --- //",
"// array to store id's of already created child tables",
"var children = [];",
"table.on('click', 'td.details-control', function(){",
" var tbl = $(this).closest('table'),",
" tblId = tbl.attr('id'),",
" td = $(this),",
" row = $(tbl).DataTable().row(td.closest('tr')),",
" rowIdx = row.index();",
" if(row.child.isShown()){",
" row.child.hide();",
" td.html('⊕');",
" } else {",
" var childId = tblId + '-child-' + rowIdx;",
" if(children.indexOf(childId) === -1){",
" // this child has not been created yet",
" children.push(childId);",
" row.child(formatHeader(row.data(), childId)).show();",
" td.html('⊖');",
" formatDatatable(row.data(), childId, rowIdx);",
" }else{",
" // this child has already been created",
" row.child(true);",
" td.html('⊖');",
" }",
" }",
"});")Now, here is the code which generates the table. The first column contains some HTML (⊕) so we have to not escape it. The last column contains the child data, it has to be hidden. Finally we assign the class details-control to the first column, this is used by the callback.
datatable(
  Dat,
  callback = callback, rownames = rowNames, escape = -colIdx-1,
  options = list(
    paging = FALSE,
    searching = FALSE,
    columnDefs = list(
      list(
        visible = FALSE,
        targets = ncol(Dat)-1+colIdx
      ),
      list(
        orderable = FALSE,
        className = "details-control",
        targets = colIdx
      ),
      list(
        className = "dt-center",
        targets = "_all"
      )
    )
  )
)
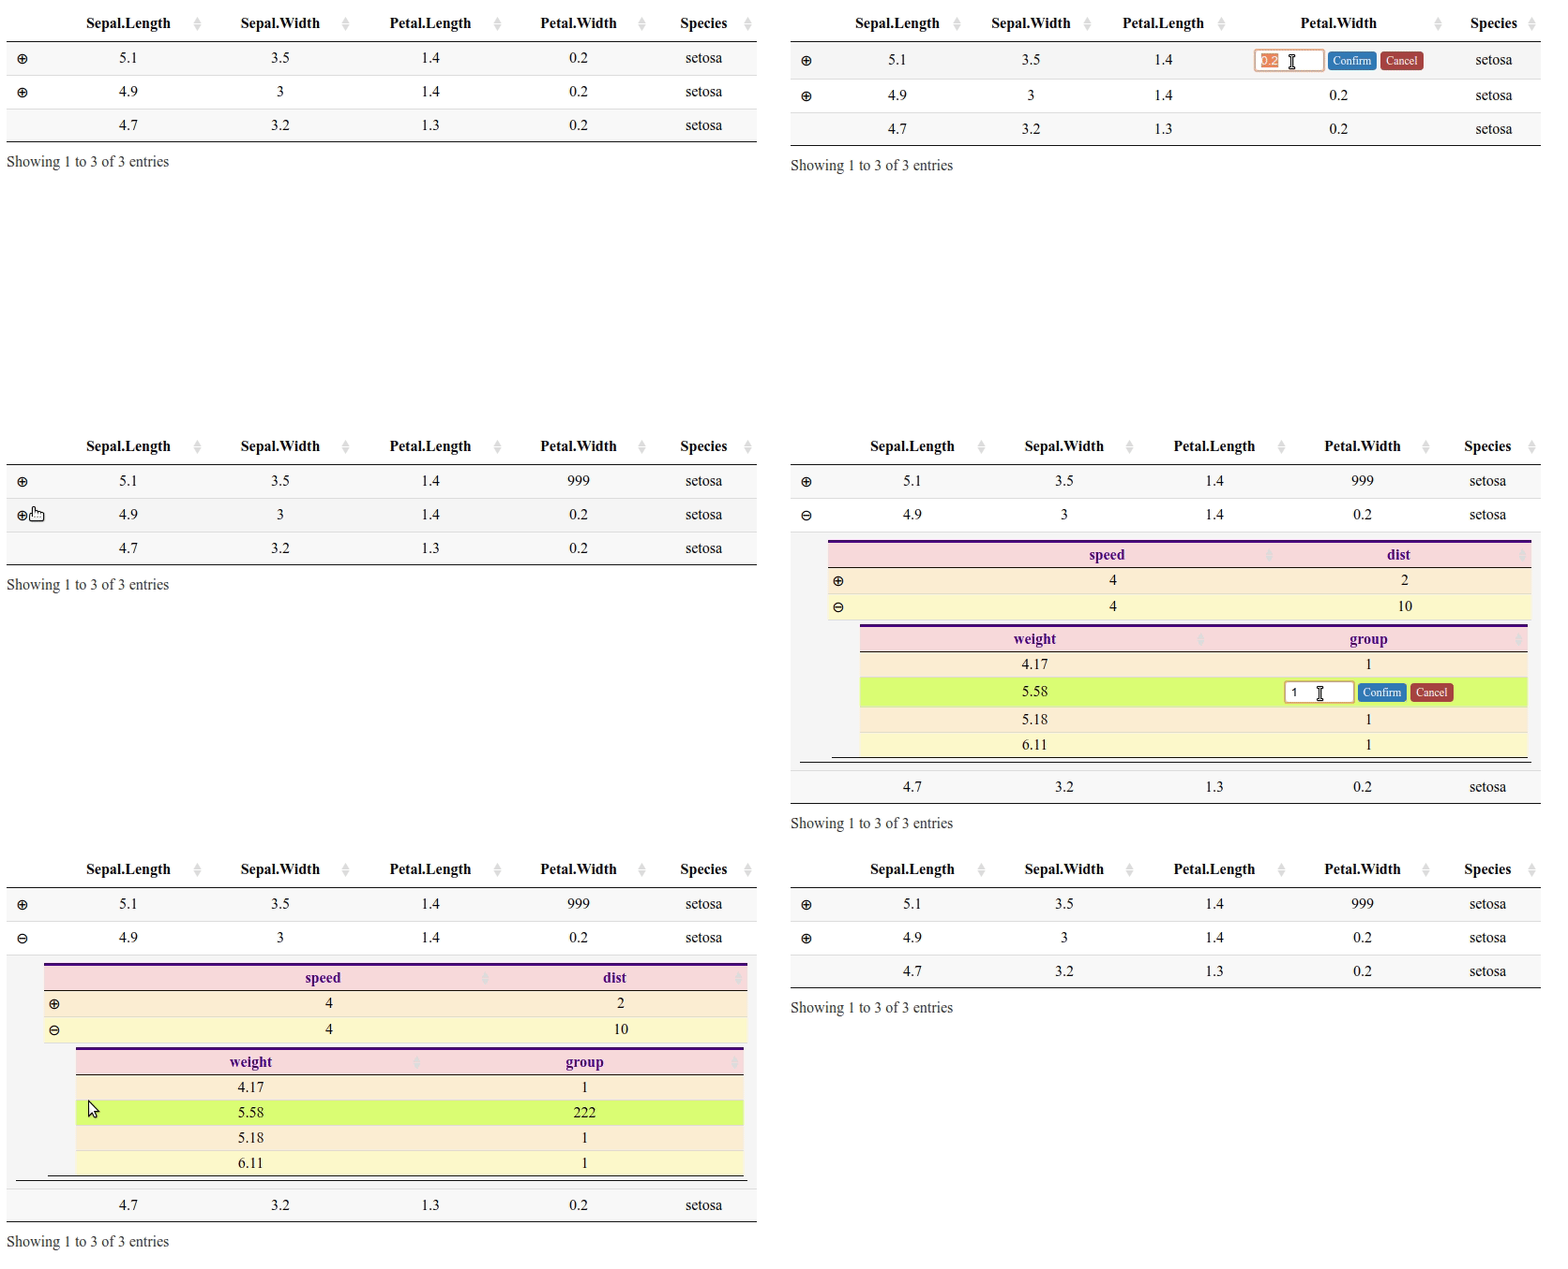
Editing
We use the JavaScript library CellEdit to allow cells, including the cells of the child tables, to be editable. Download the file dataTables.cellEdit.js.
Some CSS is required in order to make things pretty. Save the following CSS code in a file dataTables.cellEdit.css.
.my-input-class {
  padding: 3px 6px;
  border: 1px solid #ccc;
  border-radius: 4px;
  width: 60px;
}

.my-confirm-class {
  padding: 3px 6px;
  font-size: 12px;
  color: white;
  text-align: center;
  vertical-align: middle;
  border-radius: 4px;
  background-color: #337ab7;
  text-decoration: none;
}

.my-cancel-class {
  padding: 3px 6px;
  font-size: 12px;
  color: white;
  text-align: center;
  vertical-align: middle;
  border-radius: 4px;
  background-color: #a94442;
  text-decoration: none;
}
Now modify the callback as follows:
callback <- JS(
  "function onUpdate(updatedCell, updatedRow, oldValue) {};",
  "table.MakeCellsEditable({",
  "  onUpdate: onUpdate,",
  "  inputCss: 'my-input-class',",
  "  confirmationButton: {",
  "    confirmCss: 'my-confirm-class',",
  "    cancelCss: 'my-cancel-class'",
  "  }",
  "});",
  sprintf("var parentRows = [%s];", toString(parentRows-1)),

  ......

  "// --- make the datatable --- //",
  "var formatDatatable = function(d, childId){",

  ......

  "    }).column(0).nodes().to$().css({cursor: 'pointer'});",
  "  }",
  "  subtable.MakeCellsEditable({",
  "    onUpdate: onUpdate,",
  "    inputCss: 'my-input-class',",
  "    confirmationButton: {",
  "      confirmCss: 'my-confirm-class',",
  "      cancelCss: 'my-cancel-class'",
  "    }",
  "  });",
  "};",
  "",
  "// --- display the child table on click --- //",

  ......

  "});")
Use the same code as before to generate the table but store the output:
dtable <- datatable(
  Dat,
  callback = callback, rownames = rowNames, escape = -colIdx-1,
  options = list(
    paging = FALSE,
    searching = FALSE,
    columnDefs = list(
      list(
        visible = FALSE,
        targets = ncol(Dat)-1+colIdx
      ),
      list(
        orderable = FALSE,
        className = "details-control",
        targets = colIdx
      ),
      list(
        className = "dt-center",
        targets = "_all"
      )
    )
  )
)
Now we add the dependencies to the datatable:
path <- "path/to/cellEdit" # folder containing the files
                           # dataTables.cellEdit.js and
                           # dataTables.cellEdit.css
dep <- htmltools::htmlDependency(
  "CellEdit", "1.0.19", path,
  script = "dataTables.cellEdit.js",
  stylesheet = "dataTables.cellEdit.css")
dtable$dependencies <- c(dtable$dependencies, list(dep))

dtable
Exporting
Now we show how to export a table with its child tables to an Excel file, when there is only one level of child tables (i.e. when the child tables of the main table do not have child tables themselves). To do so, we use the customize callback of the Excel button provided by the Buttons extension. I found this code on the DataTables forum. In the first row of the callback, mytable is the id of the datatable:
var table = $('#mytable').find('table').DataTable();If you don’t use Shiny, you have to set this id in the elementId argument of the datatable function. If you use Shiny, this id is the key of the element of the output object in which you assign a renderDT:
output[["mytable"]] <- renderDT({
  ......
})
The JavaScript code depends on whether the user desires a title in the Excel file, so this information has to be provided first.
excelTitle = NULL # enter title or set to NULL if you don't want a title
js_customXLSX <- JS(
  "function(xlsx){",
  "  var table = $('#mytable').find('table').DataTable();",
  "  // Number of columns.",
  sprintf("  var ncols = %d;", ncol(Dat)),
  "  // Is there a title?",
  sprintf("  var title = %s;",
          ifelse(is.null(excelTitle), "false", "true")),
  "  // Integer to Excel column: 0 -> A, 1 -> B, ..., 25 -> Z, 26 -> AA, ...",
  "  var XLcolumn = function(j){",
  "    return j < 0 ? ",
  "      '' : XLcolumn(j/26-1) + String.fromCharCode(j % 26 + 65);",
  "  };",
  "  // Get sheet.",
  "  var sheet = xlsx.xl.worksheets['sheet1.xml'];",
  "  // Get a clone of the sheet data.        ",
  "  var sheetData = $('sheetData', sheet).clone();",
  "  // Clear the current sheet data for appending rows.",
  "  $('sheetData', sheet).empty();",
  "  // Row count in Excel sheet.",
  "  var rowCount = 1;",
  "  // Iterate each row in the sheet data.",
  "  $(sheetData).children().each(function (index) {",
  "    // Used for DT row() API to get child data.",
  "    var rowIndex = title ? index - 2 : index - 1;",
  "    // Don't process row if it's the title row or the header row.",
  "    var i0 = title ? 1 : 0;",
  "    if (index > i0) {",
  "      // Get row",
  "      var row = $(this.outerHTML);",
  "      // Set the Excel row attr to the current Excel row count.",
  "      row.attr('r', rowCount);",
  "      // Iterate each cell in the row to change the row number.",
  "      row.children().each(function (index) {",
  "        var cell = $(this);",
  "        // Set each cell's row value.",
  "        var rc = cell.attr('r');",
  "        rc = rc.replace(/\\d+$/, \"\") + rowCount;",
  "        cell.attr('r', rc);",
  "      });",
  "      // Get the row HTML and append to sheetData.",
  "      row = row[0].outerHTML;",
  "      $('sheetData', sheet).append(row);",
  "      rowCount++;",
  "      // Get the child data - could be any data attached to the row.",
  "      var data = table.row(':eq(' + rowIndex + ')').data();",
  "      var childData = data[ncols-1];",
  "      if(childData.length > 0){",
  "        var colNames = Object.keys(childData[0]);",
  "        // Prepare Excel formatted row",
  "        var headerRow = '<row r=\"' + rowCount +",
  "          '\"><c t=\"inlineStr\" r=\"A' + rowCount +",
  "          '\"><is><t></t></is></c>';",
  "        for(let i = 0; i < colNames.length; i++){",
  "          headerRow = headerRow +",
  "            '<c t=\"inlineStr\" r=\"' + XLcolumn(i+1) + rowCount +",
  "            '\" s=\"7\"><is><t>' + colNames[i] +",
  "            '</t></is></c>';",
  "        }",
  "        headerRow = headerRow + '</row>';",
  "        // Append header row to sheetData.",
  "        $('sheetData', sheet).append(headerRow);",
  "        rowCount++; // Increment excel row counter.",
  "      }",
  "      // The child data is an array of rows",
  "      for(let c = 0; c < childData.length; c++){",
  "        // Get row data.",
  "        var child = childData[c];",
  "        // Prepare Excel formatted row",
  "        var childRow = '<row r=\"' + rowCount +",
  "          '\"><c t=\"inlineStr\" r=\"A' + rowCount +",
  "          '\"><is><t></t></is></c>';",
  "        for(let i = 0; i < colNames.length; i++){",
  "          childRow = childRow +",
  "            '<c t=\"inlineStr\" r=\"' + XLcolumn(i+1) + rowCount +",
  "            '\" s=\"5\"><is><t>' + child[colNames[i]] +",
  "            '</t></is></c>';",
  "        }",
  "        childRow = childRow + '</row>';",
  "        // Append row to sheetData.",
  "        $('sheetData', sheet).append(childRow);",
  "        rowCount++; // Increment excel row counter.",
  "      }",
  "      // Just append the header row and increment excel row counter.",
  "    } else {",
  "      $('sheetData', sheet).append(this.outerHTML);",
  "      rowCount++;",
  "    }",
  "  });",
  "}"
)
Let’s see an example.
dat0  = iris[1:3,]         # main table, with three rows
dat01 = airquality[1:4,]   # |- child of first row
dat02 = cars[1:2,]         # |- child of second row
dat03 = PlantGrowth[1:3,]  # |- child of third row
Dat <- NestedData(
  dat = dat0,
  children = list(dat01, dat02, dat03)
)
Below is the code generating the table with a button for the exporting. Remember, if you use Shiny, do not set elementId.
dtable <- datatable(
  Dat,
  callback = callback, rownames = rowNames, escape = -colIdx-1,
  extensions = "Buttons", elementId = "mytable",
  options = list(
    paging = FALSE,
    searching = FALSE,
    dom = "Bfrtip",
    columnDefs = list(
      list(
        visible = FALSE,
        targets = ncol(Dat)-1+colIdx
      ),
      list(
        orderable = FALSE,
        className = "details-control",
        targets = colIdx
      ),
      list(
        className = "dt-center",
        targets = "_all"
      )
    ),
    buttons = list(
      list(
        extend = "excel",
        exportOptions = list(
          orthogonal = "export",
          columns = 0:(ncol(Dat)-2)
        ),
        title = excelTitle,
        orientation = "landscape",
        customize = js_customXLSX
      )
    )
  )
)
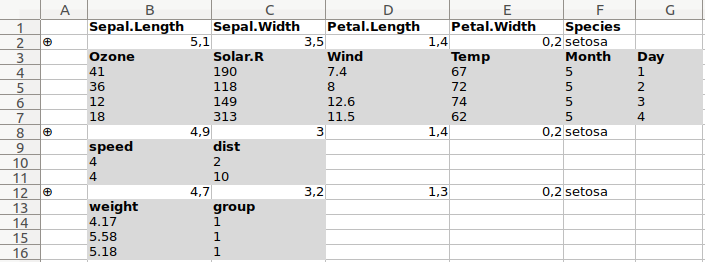
Here is the Excel file one gets:


