Useful callbacks for DT (in Shiny)
- Edit cells on pressing Tab and arrow keys
- Select rows on click and drag
- Edit columns headers
- Child tables
- Change row CSS properties on clicking an icon
- Capturing the autofilled cells
- Select page with a numeric input
Edit cells on pressing Tab and arrow keys
This callback allows a more friendly way to edit the cells:
navigate in the table, press ‘Enter’ to edit;
press ‘Enter’ to validate the edit and stay at the same position;
if you are editing a cell, then pressing ‘Tab’ or an arrow key will trigger the edit of the new cell.
This is done with the help of the KeyTable extension.
library(shiny)
library(DT)

js <- c(
  "table.on('key', function(e, datatable, key, cell, originalEvent){",
  "  var targetName = originalEvent.target.localName;",
  "  if(key == 13 && targetName == 'body'){",
  "    $(cell.node()).trigger('dblclick.dt');",
  "  }",
  "});",
  "table.on('keydown', function(e){",
  "  var keys = [9,13,37,38,39,40];",
  "  if(e.target.localName == 'input' && keys.indexOf(e.keyCode) > -1){",
  "    $(e.target).trigger('blur');",
  "  }",
  "});",
  "table.on('key-focus', function(e, datatable, cell, originalEvent){",
  "  var targetName = originalEvent.target.localName;",
  "  var type = originalEvent.type;",
  "  if(type == 'keydown' && targetName == 'input'){",
  "    if([9,37,38,39,40].indexOf(originalEvent.keyCode) > -1){",
  "      $(cell.node()).trigger('dblclick.dt');",
  "    }",
  "  }",
  "});"
)

ui <- fluidPage(
  DTOutput("table")
)

server <- function(input, output, session){
  output[["table"]] <- renderDT({
    datatable(
      iris,
      selection = "none",
      editable = TRUE,
      callback = JS(js),
      extensions = "KeyTable",
      options = list(
        keys = TRUE
      )
    )
  })
}

shinyApp(ui, server)
Select rows on click and drag
With this callback, which resorts to jquery-ui, you can select some rows on click and drag. You can also deselect all selected rows by double-clicking on the table.
library(shiny)
library(DT)

callback <- c(
  "var dt = table.table().node();",
  "$(dt).selectable({",
  "  distance : 10,",
  "  selecting: function(evt, ui){",
  "    $(this).find('tbody tr').each(function(i){",
  "      if($(this).hasClass('ui-selecting')){",
  "        table.row(i).select();",
  "      }",
  "    });",
  "  }",
  "}).on('dblclick', function(){table.rows().deselect();});"
)

ui <- fluidPage(
  DTOutput("dt")
)

server <- function(input, output){
  output[["dt"]] <- renderDT({
    dtable <- datatable(
      iris, extensions = "Select",
      callback = JS(callback), selection = "multiple"
    )
    dep <- htmltools::htmlDependency("jqueryui", "1.12.1",
                                     "www/shared/jqueryui",
                                     script = "jquery-ui.min.js",
                                     package = "shiny")
    dtable$dependencies <- c(dtable$dependencies, list(dep))
    dtable
  })
}

shinyApp(ui, server)
Unfortunately there is an issue: when you sort a column, the selected rows are lost. Below is another code which overcomes this issue; it uses a slightly different callback and the option server = FALSE.
library(shiny)
library(DT)

callback <- c(
  "var dt = table.table().node();",
  "$(dt).selectable({",
  "  distance : 10,",
  "  selecting: function(evt, ui){",
  "    $(this).find('tbody tr').each(function(i){",
  "      if($(this).hasClass('ui-selecting')){",
  "        table.row(':eq(' + i + ')').select();",
  "      }",
  "    });",
  "  }",
  "}).on('dblclick', function(){table.rows().deselect();});"
)

ui <- fluidPage(
  DTOutput("dt")
)

server <- function(input, output){
  output[["dt"]] <- renderDT({
    dtable <- datatable(
      iris, extensions = "Select",
      callback = JS(callback), selection = "multiple"
    )
    dep <- htmltools::htmlDependency("jqueryui", "1.12.1",
                                     "www/shared/jqueryui",
                                     script = "jquery-ui.min.js",
                                     package = "shiny")
    dtable$dependencies <- c(dtable$dependencies, list(dep))
    dtable
  }, server = FALSE)
}

shinyApp(ui, server)
Getting the selected rows
With the above code, input[["dt_selected_rows"]] provides only the rows selected by clicking, not the ones selected by dragging. Here is a code allowing to get both. The rows selected by clicking are given in input[["dt_selected_rows"]], while the ones selected by dragging are given in input[["dt_selected_rows2"]]. There are some duplicates so we have to use unique.
library(shiny)
library(DT)

callback <- c(
  "function distinct(value, index, self){
    return self.indexOf(value) === index;
  }",
  "var dt = table.table().node();",
  "var tblID = $(dt).closest('.datatables').attr('id');",
  "var inputName = tblID + '_rows_selected2'",
  "var selected = [];",
  "$(dt).selectable({",
  "  distance : 10,",
  "  selecting: function(evt, ui){",
  "    $(this).find('tbody tr').each(function(i){",
  "      if($(this).hasClass('ui-selecting')){",
  "        var row = table.row(':eq(' + i + ')')",
  "        row.select();",
  "        var rowIndex = parseInt(row.id().split('-')[1]);",
  "        selected.push(rowIndex);",
  "        selected = selected.filter(distinct);",
  "        Shiny.setInputValue(inputName, selected);",
  "      }",
  "    });",
  "  }",
  "}).on('dblclick', function(){table.rows().deselect();});",
  "table.on('click', 'tr', function(){",
  "  var row = table.row(this);",
  "  if(!$(this).hasClass('selected')){",
  "    var rowIndex = parseInt(row.id().split('-')[1]);",
  "    var index = selected.indexOf(rowIndex);",
  "    if(index > -1){",
  "       selected.splice(index, 1);",
  "    }",
  "  }",
  "  Shiny.setInputValue(inputName, selected);",
  "});"
)

ui <- fluidPage(
  DTOutput("dt"),
  br(),
  verbatimTextOutput("selectedRows")
)

dat <- iris
dat$ROWID <- paste0("row-", 1:nrow(dat))

rowNames <- TRUE # whether to show row names in the table
colIndex <- as.integer(rowNames)

server <- function(input, output){
  output[["dt"]] <- renderDT({
    dtable <- datatable(
      dat, rownames = rowNames,
      extensions = "Select",
      callback = JS(callback),
      selection = "multiple",
      options = list(
        rowId = JS(sprintf("function(data){return data[%d];}",
                           ncol(dat)-1L+colIndex)),
        columnDefs = list( # hide the ROWID column
          list(visible = FALSE, targets = ncol(dat)-1L+colIndex)
        )
      )
    )
    dep <- htmltools::htmlDependency("jqueryui", "1.12.1",
                                     "www/shared/jqueryui",
                                     script = "jquery-ui.min.js",
                                     package = "shiny")
    dtable$dependencies <- c(dtable$dependencies, list(dep))
    dtable
  }, server = FALSE)

  selectedRows <- reactive({
    unique(
      c(input[["dt_rows_selected"]], input[["dt_rows_selected2"]])
    )
  })

  output[["selectedRows"]] <- renderText({
    selectedRows()
  })
}

shinyApp(ui, server)
Edit columns headers
This callback uses the jQuery contextMenu library. It allows to edit a column header by right-clicking on it. When done, press ‘Escape’ or move the mouse.
library(shiny)
library(DT)

callback <- c(
  "$.contextMenu({",
  "  selector: '#table th',",
  "  trigger: 'right',",
  "  autoHide: true,",
  "  items: {",
  "    text: {",
  "      name: 'Enter column header:',",
  "      type: 'text',",
  "      value: ''",
  "    }",
  "  },",
  "  events: {",
  "    show: function(opts){",
  "      $.contextMenu.setInputValues(opts, {text: opts.$trigger.text()});",
  "    },",
  "    hide: function(opts){",
  "      var $this = this;",
  "      var data = $.contextMenu.getInputValues(opts, $this.data());",
  "      var $th = opts.$trigger;",
  "      $th.text(data.text);",
  "    }",
  "  }",
  "});"
)

ui <- fluidPage(
  tags$head(
    tags$link(
      rel = "stylesheet",
      href = "https://cdnjs.cloudflare.com/ajax/libs/jquery-contextmenu/2.8.0/jquery.contextMenu.min.css"
    ),
    tags$script(
      src = "https://cdnjs.cloudflare.com/ajax/libs/jquery-contextmenu/2.8.0/jquery.contextMenu.min.js"
    )
  ),
  DTOutput("table")
)

server <- function(input, output){
  output[["table"]] <- renderDT({
    datatable(iris, callback = JS(callback))
  }, server = FALSE)
}

shinyApp(ui, server)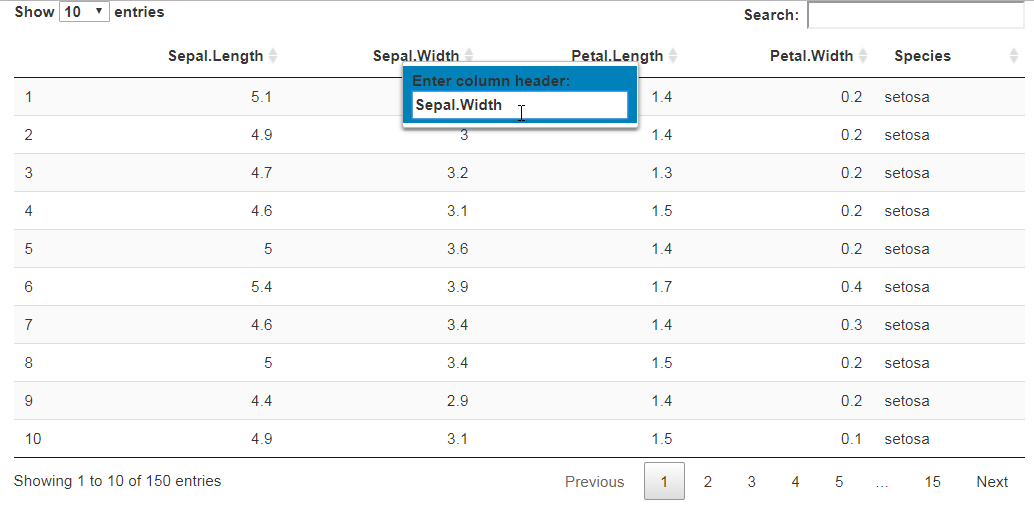
Child tables
This callback allows to display child tables in the table. The indices of the selected rows of the child tables are sent to the Shiny server.
library(shiny)
library(DT)
library(jsonlite)

## data ####
dat <- data.frame(
  Sr = c(1.5, 2.3),
  Description = c("A - B", "X - Y")
)
## details of row 1
subdat1 <- data.frame(
  Chromosome = "chr18",
  SNP = "rs2",
  stringsAsFactors = FALSE
)
## details of row 2
subdat2 <- data.frame(
  Chromosome = c("chr19","chr20"),
  SNP = c("rs3","rs4"),
  stringsAsFactors = FALSE
)
## merge the row details
subdats <- lapply(list(subdat1, subdat2), purrr::transpose)
## dataframe for the datatable
Dat <- cbind(" " = "expand", dat, details = I(subdats))

## the callback ####
registerInputHandler("x.child", function(x, ...) {
  fromJSON(toJSON(x, auto_unbox = TRUE, null = "null"),
           simplifyDataFrame = FALSE)
}, force = TRUE)

callback = JS(
  "var expandColumn = table.column(0).data()[0] === 'plus-sign' ? 0 : 1;",
  "table.column(expandColumn).nodes().to$().css({cursor: 'pointer'});",
  "",
  "// send selected columns of the main table to Shiny",
  "var tbl = table.table().node();",
  "var tblId = $(tbl).closest('.datatables').attr('id');",
  "var selector = 'td:not(:nth-child(' + (expandColumn+1) + '))';",
  "table.on('click', selector, function(){",
  "  setTimeout(function(){",
  "    var indexes = table.rows({selected:true}).indexes();",
  "    var indices = Array(indexes.length);",
  "    for(var i = 0; i < indices.length; ++i){",
  "      indices[i] = indexes[i];",
  "    }",
  "    Shiny.setInputValue(tblId + '_rows_selected', indices);",
  "  },0);",
  "});",
  "",
  "// make the table header of the nested table",
  "var format = function(d, childId){",
  "  if(d != null){",
  "    var html = '<table class=\"compact hover\" id=\"' + ",
  "                childId + '\"><thead><tr>';",
  "    for(var key in d[d.length-1][0]){",
  "      html += '<th>' + key + '</th>';",
  "    }",
  "    html += '</tr></thead></table>'",
  "    return html;",
  "  } else {",
  "    return '';",
  "  }",
  "};",
  "",
  "// row callback to style the rows background colors of the child tables",
  "var rowCallback = function(row, dat, displayNum, index){",
  "  if($(row).hasClass('odd')){",
  "    $(row).css('background-color', 'papayawhip');",
  "    $(row).hover(function(){",
  "      $(this).css('background-color', '#E6FF99');",
  "    }, function() {",
  "      $(this).css('background-color', 'papayawhip');",
  "    });",
  "  } else {",
  "    $(row).css('background-color', 'lemonchiffon');",
  "    $(row).hover(function(){",
  "      $(this).css('background-color', '#DDFF75');",
  "    }, function() {",
  "      $(this).css('background-color', 'lemonchiffon');",
  "    });",
  "  }",
  "};",
  "",
  "// header callback to style the header of the child tables",
  "var headerCallback = function(thead, data, start, end, display){",
  "  $('th', thead).css({",
  "    'border-top': '3px solid indigo',",
  "    'color': 'indigo',",
  "    'background-color': '#fadadd'",
  "  });",
  "};",
  "",
  "// make the child table",
  "var format_datatable = function(d, childId){",
  "  var dataset = [];",
  "  var n = d.length - 1;",
  "  for(var i = 0; i < d[n].length; i++){",
  "    var datarow = $.map(d[n][i], function(value, index){",
  "      return [value];",
  "    });",
  "    dataset.push(datarow);",
  "  }",
  "  var id = 'table#' + childId;",
  "  var subtable = $(id).DataTable({",
  "             'data': dataset,",
  "             'autoWidth': true,",
  "             'deferRender': true,",
  "             'info': false,",
  "             'lengthChange': false,",
  "             'ordering': d[n].length > 1,",
  "             'order': [],",
  "             'paging': false,",
  "             'scrollX': false,",
  "             'scrollY': false,",
  "             'searching': false,",
  "             'sortClasses': false,",
  "             'rowCallback': rowCallback,",
  "             'headerCallback': headerCallback,",
  "             'select': {style: 'multi'},",
  "             'columnDefs': [{targets: '_all', className: 'dt-center'}]",
  "           });",
  "};",
  "",
  "// send selected rows of the children tables to shiny server",
  "var nrows = table.rows().count();",
  "var nullinfo = Array(nrows);",
  "for(var i = 0; i < nrows; ++i){",
  "  nullinfo[i] = {row: i, selected: null};",
  "}",
  "Shiny.setInputValue(tblId + '_children:x.child', nullinfo);",
  "var sendToR = function(){",
  "  var info = [];",
  "  setTimeout(function(){",
  "    for(var i = 0; i < nrows; ++i){",
  "      var childId = 'child-' + i;",
  "      var childtbl = $('#'+childId).DataTable();",
  "      var indexes = childtbl.rows({selected:true}).indexes();",
  "      var indices;",
  "      if(indexes.length > 0){",
  "        indices = Array(indexes.length);",
  "        for(var j = 0; j < indices.length; ++j){",
  "          indices[j] = indexes[j];",
  "        }",
  "      } else {",
  "        indices = null;",
  "      }",
  "      info.push({row: i, selected: indices});",
  "    }",
  "    Shiny.setInputValue(tblId + '_children:x.child', info);",
  "  }, 0);",
  "}",
  "$('body').on('click', '[id^=child-] td', sendToR);",
  "",
  "// click event to show/hide the child tables",
  "table.on('click', 'td.details-control', function () {",
  "  var cell = table.cell(this);",
  "      row = table.row($(this).closest('tr'));",
  "  if(row.child.isShown()){",
  "    row.child.hide();",
  "    cell.data('expand');",
  "    sendToR();",
  "  } else {",
  "    var childId = 'child-' + row.index();",
  "    row.child(format(row.data(), childId)).show();",
  "    row.child.show();",
  "    cell.data('collapse-down');",
  "    format_datatable(row.data(), childId);",
  "  }",
  "});")

## render function, to display the glyphicons ####
render <- c(
  "function(data, type, row, meta){",
  "  if(type === 'display'){",
  "    return '<span style=\\\"color:black; font-size:18px\\\">' + ",
  "       '<i class=\\\"glyphicon glyphicon-' + data + '\\\"></i></span>';",
  "  } else {",
  "    return data;",
  "  }",
  "}"
)

## shiny app ####
ui <- fluidPage(
  DTOutput("table"),
  br(),
  fluidRow(
    column(6,
           tags$label("Selected row(s) of main table:"),
           verbatimTextOutput("info-main")
    ),
    column(6,
           tags$label("Selected row(s) of child tables:"),
           verbatimTextOutput("info-children")
    )
  )
)

server <- function(input, output){
  output[["table"]] <- renderDT({
    datatable(Dat, callback = callback, escape = -2,
              extensions = "Select", selection = "none",
              options = list(
                select = list(style = "multi", selector = ".selectable"),
                autoWidth = FALSE,
                columnDefs = list(
                  list(className = "selectable dt-center",
                       targets = c(0, 2:ncol(Dat))),
                  list(visible = FALSE, targets = ncol(Dat)),
                  list(orderable = FALSE, className = 'details-control',
                       width = "10px", render = JS(render), targets = 1),
                  list(className = "dt-center", targets = "_all")
                )
              )
    )
  }, server = FALSE)

  output[["info-main"]] <- renderText({
    capture.output(input[["table_rows_selected"]])
  })

  output[["info-children"]] <- renderText({
    paste0(capture.output(input[["table_children"]]), collapse = "\n")
  })

}

shinyApp(ui, server)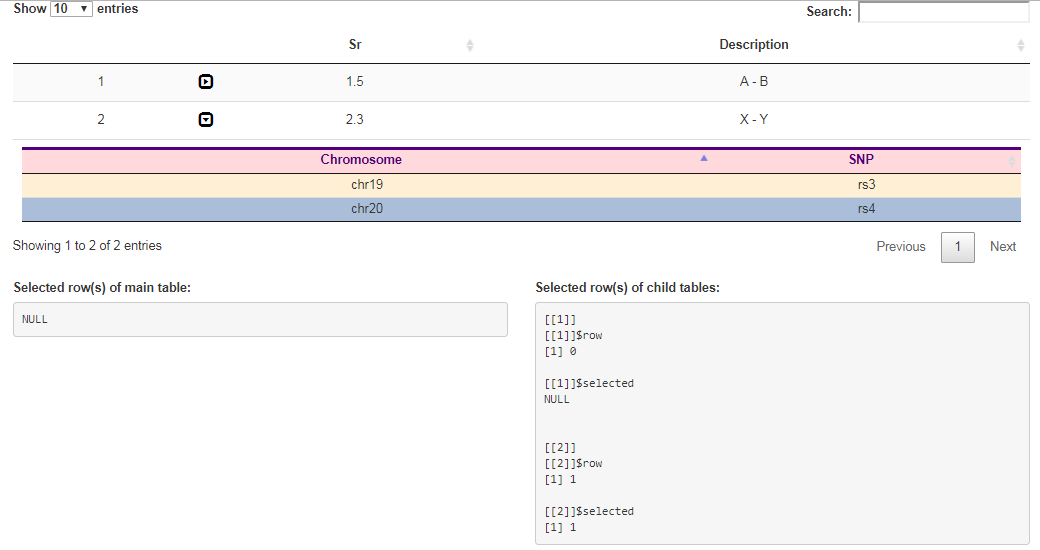
Change row CSS properties on clicking an icon
This callback allows to change the CSS properties of a row by clicking an icon. The indices of the altered rows are sent to the Shiny server.
library(shiny)
library(DT)

rowNames <- TRUE # whether to show row names in the table
colIndex <- as.integer(rowNames)

callback <- c(
  sprintf("table.on('click', 'td:nth-child(%d)', function(){", colIndex+1),
  "  var td = this;",
  "  var cell = table.cell(td);",
  "  if(cell.data() === 'ok'){",
  "    cell.data('remove');",
  "  } else {",
  "    cell.data('ok');",
  "  }",
  "  var $row = $(td).closest('tr');",
  "  $row.toggleClass('excluded');",
  "  var excludedRows = [];",
  "  table.$('tr').each(function(i, row){",
  "    if($(this).hasClass('excluded')){",
  "      excludedRows.push(parseInt($(row).attr('id').split('_')[1]));",
  "    }",
  "  });",
  "  Shiny.setInputValue('excludedRows', excludedRows);",
  "})"
)

restore <- c(
  "function(e, table, node, config) {",
  "  table.$('tr').removeClass('excluded').each(function(){",
  sprintf("    var td = $(this).find('td').eq(%d)[0];", colIndex),
  "    var cell = table.cell(td);",
  "    cell.data('ok');",
  "  });",
  "  Shiny.setInputValue('excludedRows', null);",
  "}"
)

render <- c(
  'function(data, type, row, meta){',
  '  if(type === "display"){',
  '    var color = data === "ok" ? "forestgreen" : "red";',
  '    return "<span style=\\\"color:" + color +',
  '           "; font-size:18px\\\"><i class=\\\"glyphicon glyphicon-" +',
  '           data + "\\\"></i></span>";',
  '  } else {',
  '    return data;',
  '  }',
  '}'
)

ui <- fluidPage(
  tags$head(
    tags$style(HTML(
      ".excluded { color: rgb(211,211,211); font-style: italic; }"
    ))
  ),
  fluidRow(
    column(
      6,
      tags$label("Excluded rows"),
      verbatimTextOutput("excludedRows")
    ),
    column(
      6,
      tags$label("Included rows"),
      verbatimTextOutput("includedRows")
    )
  ),
  br(),
  DTOutput("mytable")
)

server <- function(input, output,session) {

  dat <- cbind(Selected = "ok", mtcars[1:6,], id = paste0("row_",1:6))

  output[["mytable"]] <- renderDT({
    datatable(dat, rownames = rowNames,
              extensions = c("Select", "Buttons"),
              selection = "none",
              callback = JS(callback),
              options = list(
                rowId = JS(sprintf("function(data){return data[%d];}",
                                   ncol(dat)-1+colIndex)),
                columnDefs = list(
                  list(visible = FALSE, targets = ncol(dat)-1+colIndex),
                  list(className = "dt-center", targets = "_all"),
                  list(className = "notselectable", targets = colIndex),
                  list(targets = colIndex, render = JS(render))
                ),
                dom = "Bt",
                buttons = list("copy", "csv",
                               list(
                                 extend = "collection",
                                 text = 'Select all rows',
                                 action = JS(restore)
                               )
                ),
                select = list(style = "single",
                              selector = "td:not(.notselectable)")
              )
    )
  }, server = FALSE)

    output$excludedRows <- renderPrint({
      input[["excludedRows"]]
    })

    output$includedRows <- renderPrint({
      setdiff(1:nrow(dat), input[["excludedRows"]])
    })

}

shinyApp(ui, server)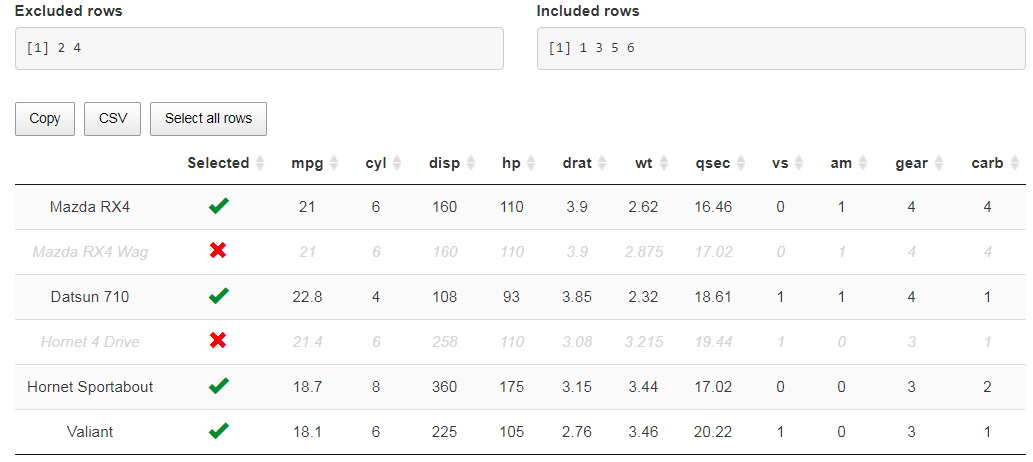
Capturing the autofilled cells
The AutoFill extension gives an Excel like option to a DataTable to click and drag over multiple cells, filling in information over the selected cells and incrementing numbers as needed.
The callback below allows to update the data in the R server when some cells are edited or changed by autofilling.
library(shiny)
library(DT)

callback <- c(
  "var tbl = $(table.table().node());",
  "var id = tbl.closest('.datatables').attr('id');",
  "table.on('autoFill', function(e, datatable, cells){",
  "  var out = [];",
  "  for(var i = 0; i < cells.length; ++i){",
  "    var cells_i = cells[i];",
  "    for(var j = 0; j < cells_i.length; ++j){",
  "      var c = cells_i[j];",
  "      var value = c.set === null ? '' : c.set;", # null => problem in R
  "      out.push({",
  "        row: c.index.row + 1,",
  "        col: c.index.column,",
  "        value: value",
  "      });",
# to color the autofilled cells, uncomment the two lines below
#  "      $(table.cell(c.index.row, c.index.column).node())",
#  "        .css('background-color', 'yellow');",
  "    }",
  "  }",
  "  Shiny.setInputValue(id + '_cells_filled:DT.cellInfo', out);",
  "  table.rows().invalidate();", # this updates the column type
  "});"
)

ui <- fluidPage(
  br(),
  DTOutput("dt"),
  br(),
  verbatimTextOutput("table")
)

server <- function(input, output){

  dat <- iris[1:5,]
  dat$Species <- as.character(dat$Species)

  output[["dt"]] <- renderDT({
    datatable(dat,
              editable = list(target = "cell"),
              selection = "none",
              extensions = "AutoFill",
              callback = JS(callback),
              options = list(
                autoFill = TRUE
              )
    )
  }, server = TRUE)

  Data <- reactive({
    info <- rbind(input[["dt_cells_filled"]], input[["dt_cell_edit"]])
    if(!is.null(info)){
      info <- unique(info)
      info$value[info$value==""] <- NA
      dat <<- editData(dat, info, proxy = "dt")
    }
    dat
  })

  output[["table"]] <- renderPrint({Data()})
}

shinyApp(ui, server)
If you use server = FALSE in renderDT, just remove the proxy argument in editData:
Select page with a numeric input
The default pagination is not convenient when there are many pages (the user has to click multiple times on the ‘Next’ or ‘Previous’ button). This callback allows to select a page with a numeric input.
library(shiny)
library(DT)

shinyApp(
  ui = fluidPage(
    tags$head(tags$style(".pagination {float: right;}")),
    fluidRow(
      div(id="pagination",
          div(style = "display:inline-block;",
              tags$a(id = "first", style = "cursor: pointer;", "First")),
          div(style = "display:inline-block;",
              tags$a(id = "previous", style = "cursor: pointer;", " Previous")),
          div(style = "display:inline-block;",
              tags$input(id="page", type="number", class="input-sm", value="1", min="1")
          ),
          div(style = "display:inline-block;",
              tags$span(id = "of")),
          div(style = "display:inline-block;",
              tags$a(id = "next", style = "cursor: pointer;", "Next ")),
          div(style = "display:inline-block;",
              tags$a(id = "last", style = "cursor: pointer;", "Last"))
      )
    ),
    fluidRow(
      column(12, DTOutput('tbl'))
    )
  ),
  server = function(input, output) {
    output$tbl = renderDT({
      datatable(
        iris, options = list(
          dom = "lfrti<'pagination'>",
          initComplete = JS(c(
            "function(settings, json){",
            "  var table = settings.oInstance.api();",
            "  var pageinfo = table.page.info();",
            "  $('#of').text('of ' + pageinfo.pages);",
            "}"
          ))
        ),
        callback = JS(c(
          "$('div.pagination').append($('#pagination'));",
          "$('#first').on('click', function(){",
          "  table.page('first').draw('page');",
          "  $('#page').val(1);",
          "});",
          "$('#previous').on('click', function(){",
          "  table.page('previous').draw('page');",
          "  $('#page').val(table.page.info().page + 1);",
          "});",
          "$('#next').on('click', function(){",
          "  table.page('next').draw('page');",
          "  $('#page').val(table.page.info().page + 1);",
          "});",
          "$('#last').on('click', function(){",
          "  table.page('last').draw('page');",
          "  $('#page').val(table.page.info().pages);",
          "});",
          "$('#page').on('change', function(){",
          "  var page = parseInt($('#page').val());",
          "  if(!isNaN(page)){ table.page(page-1).draw('page'); }",
          "});"
        ))
      )
    })
  }
)