The Doyle spiral with R
Posted on July 8, 2023
by Stéphane Laurent
I translated to R the JavaScipt code for the Doyle spiral written by Robin Houston and kindly provided in this gist.
library(rootSolve) # for the function multiroot
library(plotrix)   # for the function draw.circle

d_ <- function(z, t, p, q) {
  w <- z^(p/q)
  s <- (p*t + 2*pi)/q
  (z*cos(t) - w*cos(s))^2 + (z*sin(t) - w*sin(s))^2
}

s_ <- function(z, p, q) {
  (z + z^(p/q))^2
}

r_ <- function(z, t, p, q) {
 d_(z, t, p, q) / s_(z, p, q)
}

Doyle <- function(p, q) {
  f_ <- function(z, t) {
    r_(z, t, 0, 1) - r_(z, t, p, q)
  }
  g_ <- function(z, t) {
    r_(z, t, 0, 1) - r_(z^(p/q), (p*t + 2*pi)/q, 0, 1)
  }
  model <- function(x) c(F = f_(x[1], x[2]),
                         G = g_(x[1], x[2]))
  ss <- multiroot(f = model, start = c(2, 0),
                  maxiter = 1000, atol = 1e-6, rtol = 1e-6)
  z <- ss$root[1L]
  t <- ss$root[2L]
  r <- sqrt(r_(z, t, 0, 1))
  a <- complex(real = z * cos(t), imaginary = z * sin(t))
  coroot <- c("z" = z^(p/q), "t" = (p*t + 2*pi)/q)
  b <- complex(
    real      = coroot["z"] * cos(coroot["t"]),
    imaginary = coroot["z"] * sin(coroot["t"])
  )
  list("a" = a, "b" = b, "r" = r, "mod_a" = z, "arg_a" = t, "q" = q)
}

spiral <- function(r, start_point, delta, opts, alpha, scale) {
  mod_delta <- Mod(delta)
  colors <- opts[["fill"]]
  min_d  <- opts[["min_d"]]
  max_d  <- opts[["max_d"]]
  w <- exp(1i * alpha)

  out <- matrix(nrow = 0L, ncol = 4L)

  # spiral outwards
  color_index <- opts[["i"]]
  q <- start_point
  mod_q <- Mod(q)
  while(mod_q < max_d) {
    col <- colors[color_index]
    center <- scale * q * w
    out <- rbind(
      out,
      c(Re(center), Im(center), r * scale * mod_q, color_index)
    )
    draw.circle(
      Re(center), Im(center), r * scale * mod_q, col = col, border = col
    )
    color_index <- ifelse(color_index < length(colors), color_index + 1, 1)
    q <- q * delta
    mod_q <- mod_q * mod_delta
  }

  # spiral inwards
  i <- opts[["i"]]
  color_index <- ifelse(i > 1, i-1, length(colors))
  q <- start_point/delta
  mod_q <- Mod(q)
  while(mod_q > min_d) {
    col <- colors[color_index]
    center <- scale * q * w
    out <- rbind(
      out,
      c(Re(center), Im(center), r * scale * mod_q, color_index)
    )
    draw.circle(
      Re(center), Im(center), r * scale * mod_q, col = col, border = col
    )
    color_index <- ifelse(color_index > 1, color_index-1, length(colors))
    q <- q / delta
    mod_q <- mod_q / mod_delta
  }

  out
}

frame <- function(t, root, max_d, limits = c(-max_d, max_d)) {
  scale <- root$mod_a^t
  alpha <- root$arg_a * t
  start <- root$a
  min_d <- 1/scale
  out <- matrix(nrow = 0L, ncol = 4L)
  par(mar = c(0, 0, 0, 0))
  plot(NULL, asp = 1, xlim = limits, ylim = limits,
       xlab = NA, ylab = NA, axes = FALSE)
  for(i in 1:root$q) {
    cc <- spiral(root$r, start, root$a,
           list(
             fill = c("#49B49B", "#483352"),
             i = 1 + i %% 2,
             min_d = min_d,
             max_d = max_d
           ), alpha, scale)
    start <- start * root$b
    out <- rbind(out, cc)
  }
  colnames(out) <- c("x", "y", "r", "colIndex")
  out
}

# plot a Doyle spiral ####
root <- Doyle(p = 8, q = 16)
M <- frame(0, root, 600)
The frame function generates a plot of a Doyle spiral:
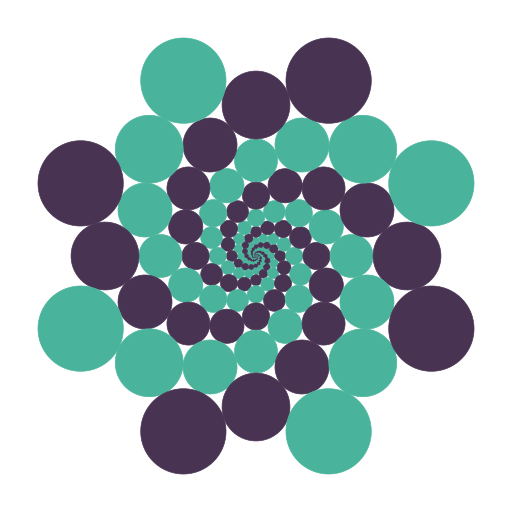
It also returns a matrix providing the centers and the radii of the circles, and the color index of each circle. This allowed me to plot the Doyle spiral in 3D with rgl:
library(rgl)
library(Rvcg)

unitSphere <- vcgSphere(4)
cols <- c("#49B49B", "#483352")
open3d(windowRect = 50 + c(0, 0, 512, 512))
view3d(0, -55, zoom = 0.85)
for(i in 1:nrow(M)) {
  sph <- translate3d(
    scale3d(unitSphere, M[i,"r"], M[i,"r"], M[i,"r"]),
    M[i, "x"], M[i,"y"], 0
  )
  shade3d(sph, color = cols[M[i, "colIndex"]])
}

# animation ####
movie3d(spin3d(axis = c(0, 0, 1), rpm = 10),
        duration = 6, fps = 10,
        movie = "zzpic", dir = ".",
        convert = FALSE, webshot = FALSE,
        startTime = 1/10)

library(gifski)
pngs <- Sys.glob("zzpic*.png")
gifski(
  png_files = pngs,
  gif_file = "Doyle_8-16.gif",
  width = 512,
  height = 512,
  delay = 1/8
)
file.remove(pngs)
And also with POV-Ray: