Plotting the columns of a Datatable
Posted on July 10, 2019
by Stéphane Laurent

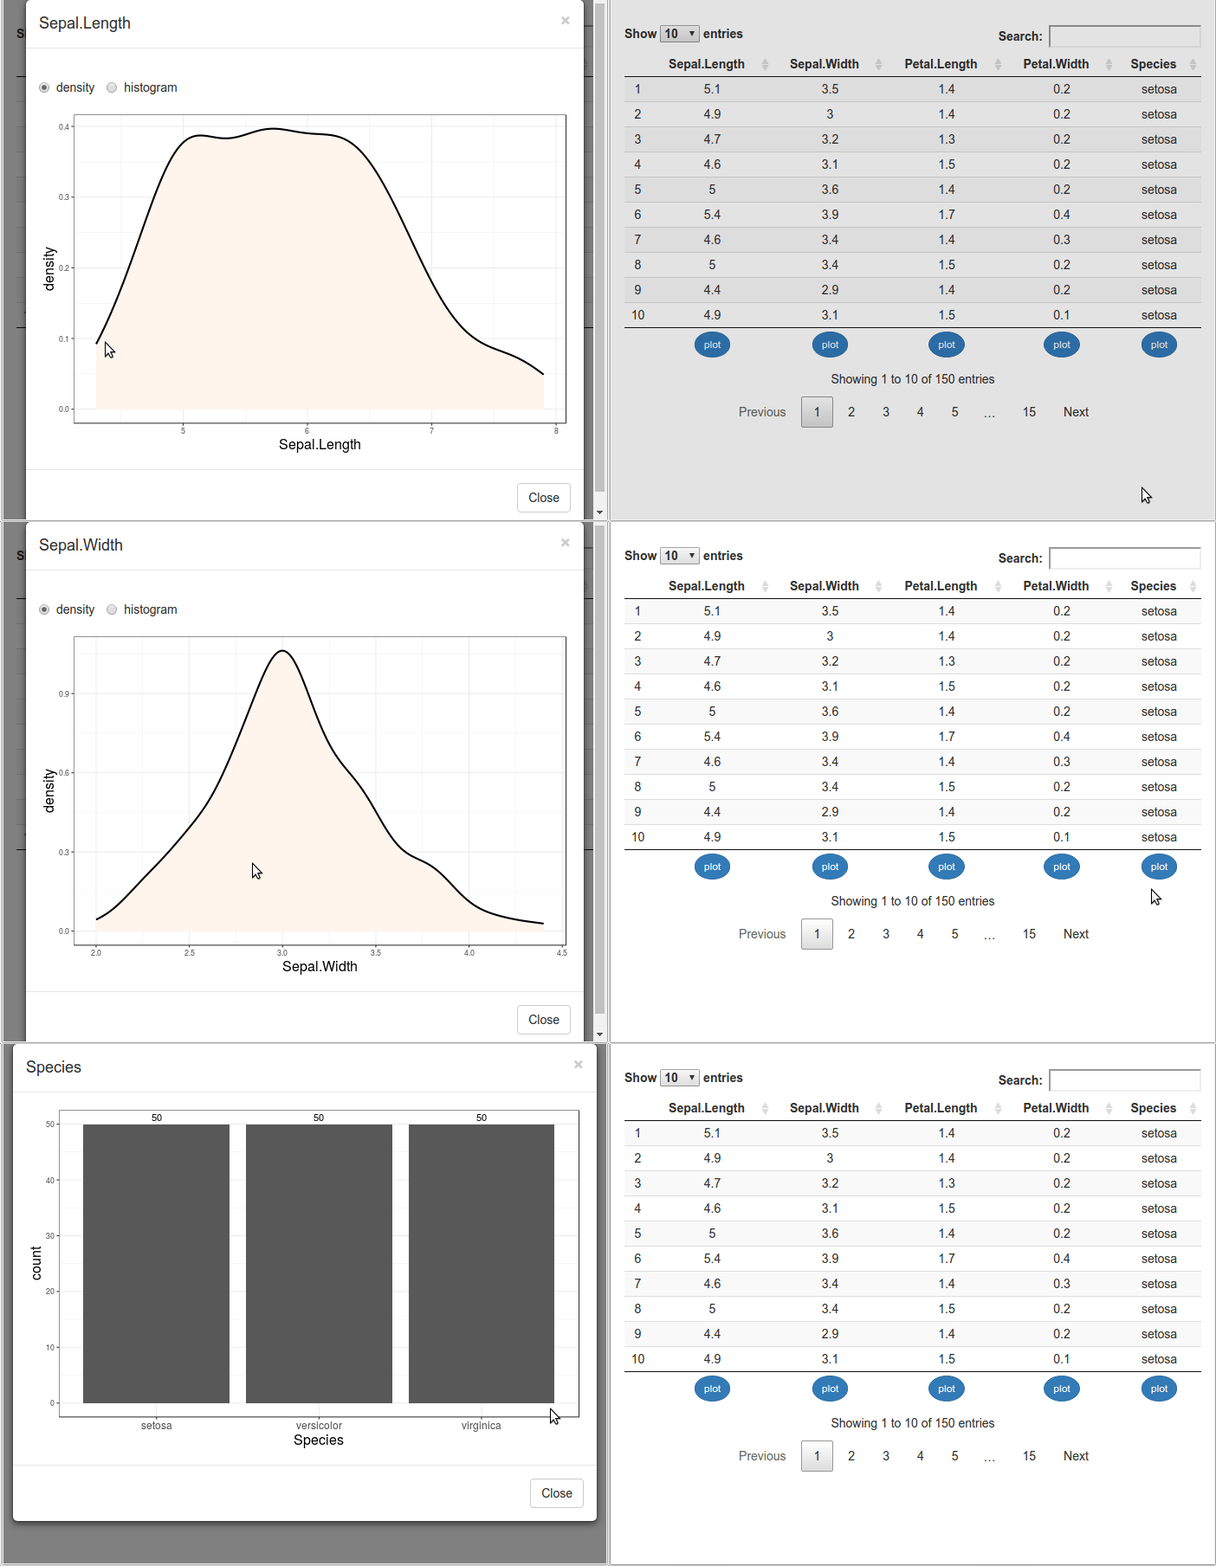
Here is the code of this app:
library(shiny)
library(shinyBS)
library(DT)
library(ggplot2)

ui <- fluidPage(
  uiOutput("modals"),
  DTOutput("table")
)

server <- function(input, output, session){

  dat <- iris

  buttons <- lapply(1:ncol(dat), function(i){
    actionButton(
      paste0("this_id_is_not_used",i),
      "plot",
      class = "btn-primary btn-sm",
      style = "border-radius: 50%;",
      onclick = sprintf(
        "Shiny.setInputValue('button', %d, {priority:'event'});
        $('#modal%d').modal('show');", i, i)
    )
  })

  output[["table"]] <- renderDT({
    sketch <- tags$table(
      class = "row-border stripe hover compact",
      tableHeader(c("", names(dat))),
      tableFooter(c("", buttons))
    )
    datatable(
      dat, container = sketch,
      options =
        list(
          columnDefs = list(
            list(
              className = "dt-center",
              targets = "_all"
            )
          )
        )
    )
  })

  # modals ####
  output[["modals"]] <- renderUI({
    lapply(1:ncol(dat), function(i){
      bsModal(
        id = paste0("modal",i),
        title = names(dat)[i],
        trigger = paste0("this_is_not_used",i),
        if(is.numeric(dat[[i]]) && length(unique(dat[[i]]))>19){
          fluidRow(
            column(5, radioButtons(paste0("radio",i), "",
                       c("density", "histogram"), inline = TRUE)),
            column(7,
                   conditionalPanel(
                     condition = sprintf("input.radio%d=='histogram'",i),
                     sliderInput(paste0("slider",i), "Number of bins",
                                 min = 5, max = 100, value = 30)
                   ))
          )
        },
        plotOutput(paste0("plot",i))
      )
    })
  })

  # plots in modals ####
  for(i in 1:ncol(dat)){
    local({
      ii <- i
      output[[paste0("plot",ii)]] <- renderPlot({
        if(is.numeric(dat[[ii]]) && length(unique(dat[[ii]]))>19){
          if(input[[paste0("radio",ii)]] == "density"){
            ggplot(dat, aes_string(names(dat)[ii])) +
              geom_density(fill = "seashell", color = "seashell") +
              stat_density(geom = "line", size = 1) +
              theme_bw() + theme(axis.title = element_text(size = 16))
          }else{
            ggplot(dat, aes_string(names(dat)[ii])) +
              geom_histogram(bins = input[[paste0("slider",ii)]]) +
              theme_bw() + theme(axis.title = element_text(size = 16))
          }
        }else{
          dat[[".x"]] <-
            factor(dat[[ii]], levels = names(sort(table(dat[[ii]]),
                                                 decreasing=TRUE)))
          gg <- ggplot(dat, aes(.x)) + geom_bar() +
            geom_text(stat="count", aes(label=..count..), vjust=-0.5) +
            xlab(names(dat)[ii]) + theme_bw()
          if(max(nchar(levels(dat$.x)))*nlevels(dat$.x)>40){
            gg <- gg + theme(axis.text.x =
                               element_text(size = 12, angle = 45,
                                            vjust = 0.5, hjust = 0.5))
          }else{
            gg <- gg + theme(axis.text.x = element_text(size = 12))
          }
          gg + theme(axis.title = element_text(size = 16))
        }
      })
    })
  }

}

shinyApp(ui, server)


