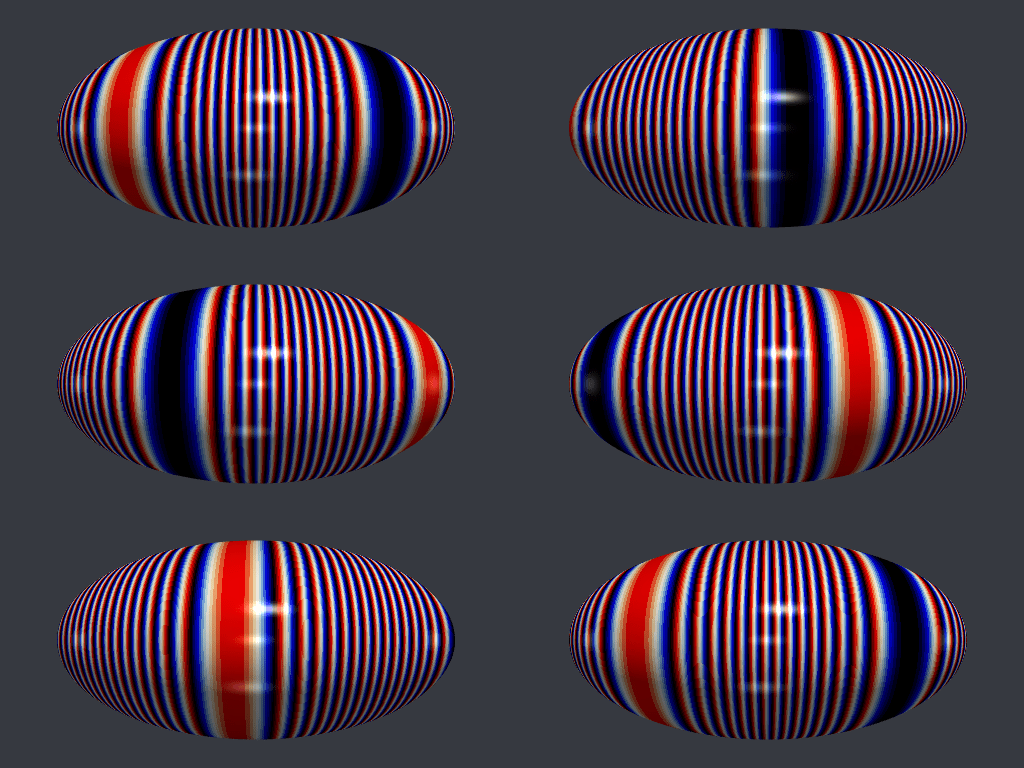
PyVista surface with dynamic colormap
Posted on January 27, 2022
by Stéphane Laurent
I’ve just done this animation with PyVista:

This is a Hopf torus with the so-called flag colormap as texture, but this texture moves. Here is a link to the full code.
The trick is to normalize the scalars to \([0, 2\pi]\) and then to apply the map \(\sin(\cdot - t)\) to the scalars, with \(t\) varying from \(0\) to \(2\pi\). Let me show you another example, with an ellipsoid.
from math import pi, sin
import numpy as np
import pyvista as pv

mesh = pv.Sphere(theta_resolution=200, phi_resolution=200)
mesh.scale((1, 0.5, 1), inplace=True) # ellipsoid
dists = mesh.points[:,2] # we take the third coordinates for the scalars
# then we map them to [0, 2*pi]:
dists = 2*pi * (dists - dists.min()) / (dists.max() - dists.min())

t_ = np.linspace(0, 2*pi, 100, endpoint=False) # the varying parameter
for i, t in enumerate(t_):
    pngfile = "pic%03d.png" % i
    pltr = pv.Plotter(window_size = [512, 256], off_screen = True)
    pltr.background_color = "#363940"
    pltr.set_focus([0, 0, 0])
    pltr.set_position((1.3, 0, 0))
    mesh["dist"] = np.sin(dists - t) # set the scalars - here is the "trick"
    pltr.add_mesh(
        mesh, smooth_shading = True, cmap = "flag",
        show_scalar_bar = False, specular = 10
    )
    pltr.show(screenshot = pngfile)
This code produces the png files pic000.png, …, pic099.png. Then it remains to make a gif file from them, using e.g. ImageMagick or gifski. And here is the result:


