Labelling the points of a 'ggplot' with Shiny
Posted on August 8, 2022
by Stéphane Laurent
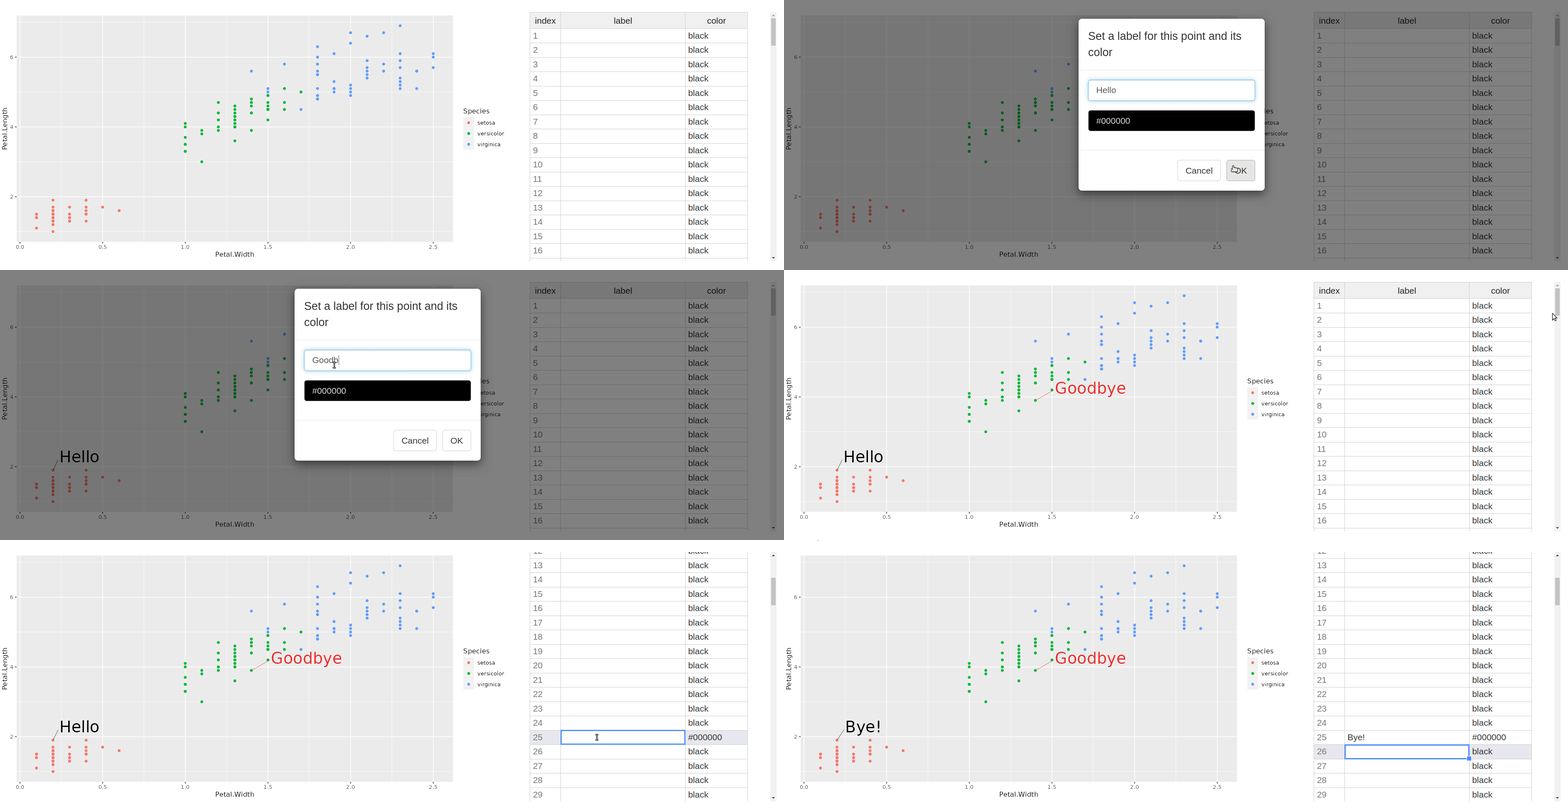
The Shiny app below allows to attribute a label to the points of a ‘ggplot’ by double-clicking on the points.
library(shiny)
library(rhandsontable)
library(htmlwidgets)
library(colourpicker)
library(ggplot2)
library(ggrepel)

#' Add labels to points on a ggplot2 scatterplot
#' @param gg the ggplot
#' @param X name of the x-variable
#' @param Y names of the y-variable
#' @param labels named list like \code{list("10" = c("mylabel", "blue"))};
#' the names of the list are the row names, each component of the list is
#' a character vector of length two: the label and its color
#' @importFrom ggrepel geom_text_repel
addLabels <- function(gg, X, Y, labels){
  if(is.null(labels)){
    return(gg)
  }
  dat <- gg$data
  indices <- intersect(names(labels), rownames(dat))
  dat[["..labels"]] <- ""
  dat[["..colors"]] <- "black"
  dat[indices, "..labels"] <- sapply(labels[indices], "[[", 1L)
  dat[indices, "..colors"] <- sapply(labels[indices], "[[", 2L)
  range_x <- diff(range(dat[[X]], na.rm = TRUE))
  range_y <- diff(range(dat[[Y]], na.rm = TRUE))
  gg + geom_text_repel(
    aes_(x = as.name(X), y = as.name(Y), label = as.name("..labels")),
    color = dat[["..colors"]], size = 9, max.overlaps = 100L,
    data = dat, inherit.aes = FALSE,
    segment.size = 0.2, min.segment.length = unit(0, 'lines'),
    nudge_x = range_x/15, nudge_y = range_y/15
  )
}

ui <- fluidPage(
  br(),
  fluidRow(
    column(
      8,
      plotOutput("ggplot", dblclick = "plotClick")
    ),
    column(
      4,
      tags$div(
        style = "max-height: 400px; overflow: auto;",
        rHandsontableOutput("hot_pointLabels")
      )
    )
  )
)

server <- function(input, output, session){

  Ggplot <- reactive({
    gg <- ggplot(iris) +
      geom_point(aes(x = Petal.Width, y = Petal.Length, color = Species))
    gg
  })

  output[["ggplot"]] <- renderPlot({
    addLabels(Ggplot(), "Petal.Width", "Petal.Length", Labels())
  })

  output[["hot_pointLabels"]] <- renderRHandsontable({
    if(!is.null(hot <- input[["hot_pointLabels"]])){
      DF <- hot_to_r(hot)
    } else {
      DF <- data.frame(
        index = rownames(iris),
        label = "",
        color = "black",
        stringsAsFactors = FALSE
      )
    }
    rhandsontable(DF, rowHeaders = NULL) %>%
      hot_col("index", readOnly = TRUE) %>%
      hot_cols(colWidths = c(50, 200, 100)) %>%
      hot_table(
        highlightRow = TRUE, contextMenu = FALSE, fillHandle = TRUE
      ) %>%
      onRender(
        "function(el, x){
          var hot = this.hot;
          Shiny.addCustomMessageHandler('handler_hot', function(msg){
            hot.setDataAtCell(msg.row, 1, msg.label);
            hot.setDataAtCell(msg.row, 2, msg.color);
          });
        }"
      )
  })

  Index <- reactiveVal()
  observeEvent(input[["plotClick"]], {
    dat <- droplevels(Ggplot()$data)
    point <- nearPoints(
      dat, input[["plotClick"]], threshold = 15, maxpoints = 1L
    )
    if(nrow(point)){
      Index(as.integer(rownames(point)))
      showModal(modalDialog(
        title = "Set a label for this point and its color",
        textInput("pointLabel", NULL, placeholder = "label"),
        colourInput("pointLabelCol", NULL, value = "black"),
        footer = tagList(
          modalButton("Cancel"),
          actionButton("ok", "OK")
        ),
        size = "s"
      ))
    }
  })

  observeEvent(input[["ok"]], {
    session$sendCustomMessage(
      "handler_hot",
      list(
        "row"   = Index() - 1L,
        "label" = input[["pointLabel"]],
        "color" = input[["pointLabelCol"]]
      )
    )
    Index(NULL)
    removeModal()
  })

  pointsLabelsTable <- reactive({
    if(!is.null(hot <- input[["hot_pointsLabels"]])){
      hot_to_r(hot)
    }else{
      NULL
    }
  })

  Labels <- eventReactive(input[["hot_pointLabels"]], {
    dat <- hot_to_r(input[["hot_pointLabels"]])
    indices <- dat[["index"]]
    labels  <- dat[["label"]]
    colors  <- dat[["color"]]
    keep <- labels != ""
    if(any(keep)){
      L <- mapply(
        c, labels[keep], colors[keep],
        SIMPLIFY = FALSE, USE.NAMES = FALSE
      )
      setNames(L, indices[keep])
    }else{
      NULL
    }
  })

}

shinyApp(ui, server)


