Custom tooltips for plotly
Posted on December 23, 2018
by Stéphane Laurent
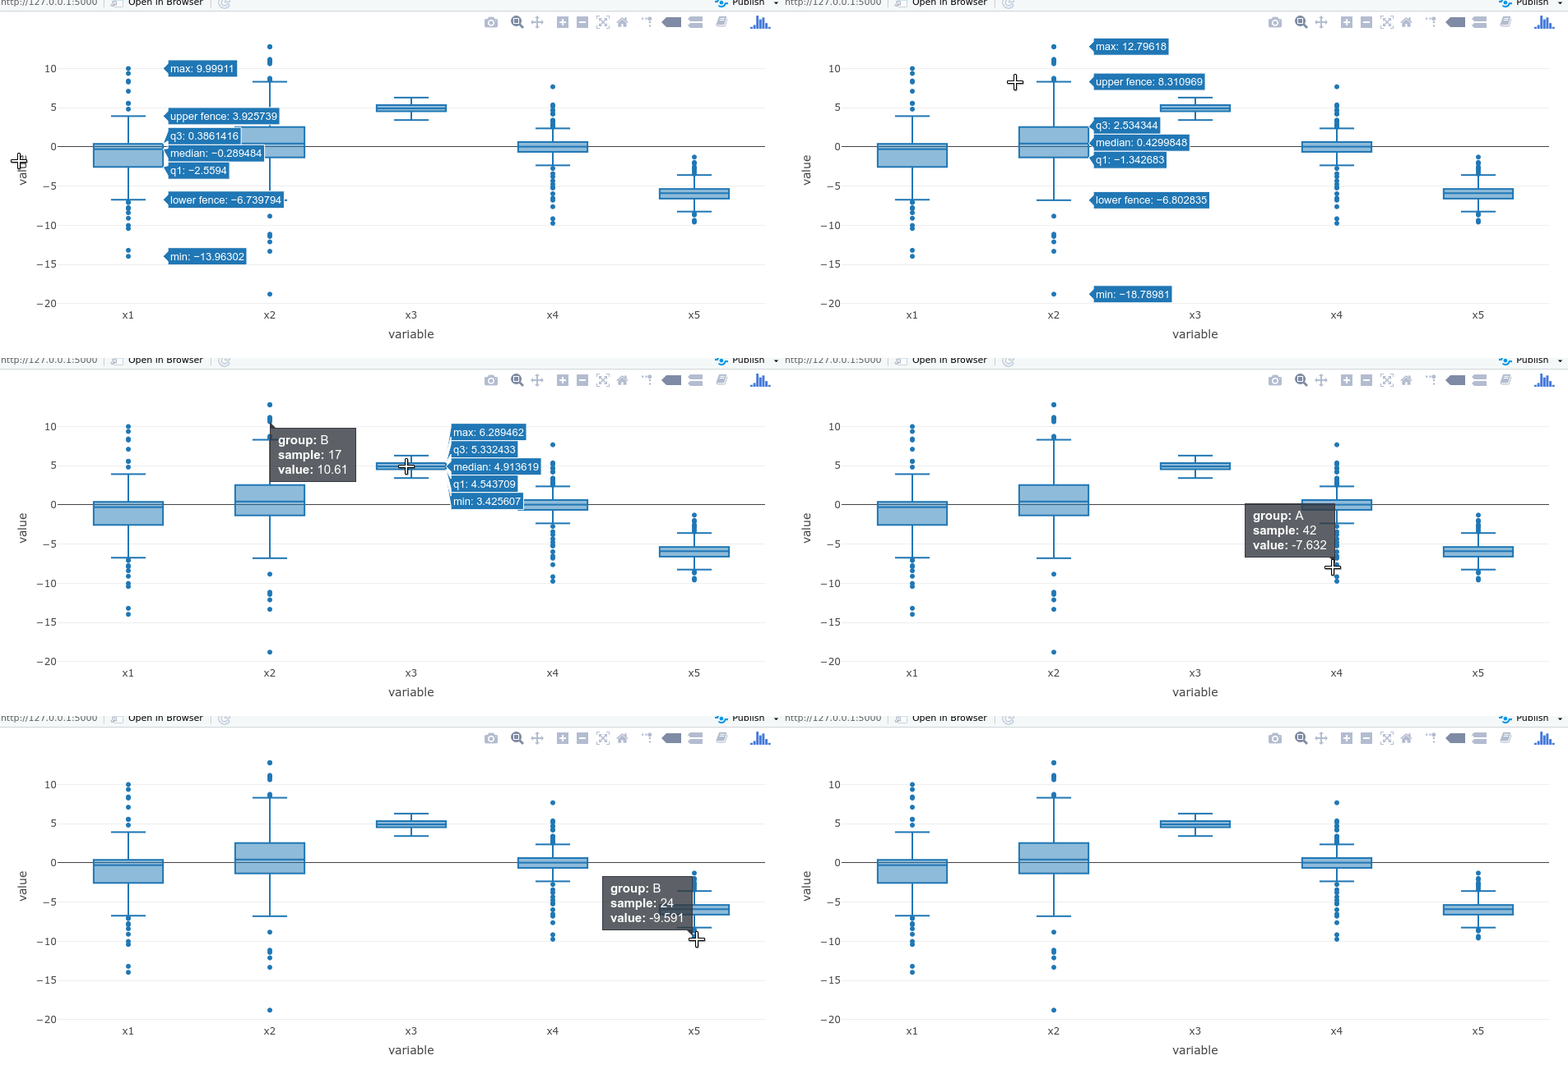
I’ve found several questions on Stackoverflow asking for tooltips on the outliers of a plotly boxplot. Here I provide a solution using Shiny and the qTip2 Javascript library.
Below is the Shiny app. Download the two files jquery.qtip.min.css and jquery.qtip.min.js and put them in the www subfolder.
library(plotly)
library(shiny)
library(shinyjs)
library(htmlwidgets)

### Prepare data ----
set.seed(666)
# group A
data_a <- data.frame(Class = "red", Group = "A",
                     Sample = 1:50,
                     x1 = rnorm(50, mean=0, sd=.5),
                     x2 = rnorm(50, mean=0.5, sd=1.5),
                     x3 = rnorm(50, mean=5, sd=.5),
                     x4 = rnorm(50, mean=0, sd=3.5),
                     x5 = rnorm(50, mean=-6, sd=.5))
# group B
data_b <- data.frame(Class = "red", Group = "B",
                     Sample = 1:50,
                     x1 = rnorm(50, mean=0, sd=5.5),
                     x2 = rnorm(50, mean=0.5, sd=7.5),
                     x3 = rnorm(50, mean=5, sd=.5),
                     x4 = rnorm(50, mean=0, sd=.5),
                     x5 = rnorm(50, mean=-6, sd=2.05))
# data in graphable format
dat <- reshape2::melt(rbind(data_a, data_b),
                      id.vars = c("Class", "Group", "Sample"))

# Plotly 'on hover' event ----
addHoverBehavior <- c(
  "function(el, x){",
  "  el.on('plotly_hover', function(data) {",
  "    if(data.points.length==1){",
  "      $('.hovertext').hide();",
  "      Shiny.setInputValue('hovering', true);",
  "      var d = data.points[0];",
  "      var left_px = d.xaxis.d2p(d.x) + d.xaxis._offset;",
  "      var top_px = d.yaxis.l2p(d.y) + d.yaxis._offset;",
  "      var rect = document.getElementById('plotly').getBoundingClientRect();",
  "      Shiny.setInputValue('left_px', left_px);",
  "      Shiny.setInputValue('top_px', top_px);",
  "      Shiny.setInputValue('left_pct', left_px/rect.width);",
  "      Shiny.setInputValue('top_pct', top_px/rect.height);",
  "      Shiny.setInputValue('d_y', d.y);",
  "      Shiny.setInputValue('d_text', d.text);",
  "    }else{",
  "      $('#hover_info').qtip('hide');",
  "    }",
  "  });",
  "  el.on('plotly_unhover', function(data) {",
  "    Shiny.setInputValue('hovering', false);",
  "  });",
  "}")

### Shiny app ----
js_qTip <- "
$('#hover_info').qtip({
  overwrite: true,
  content: {
    text: $('#tooltiptext').clone()
  },
  position: {
    my: '%s',
    at: '%s',
    target: [%s,%s],
    container: $('#plotly')
  },
  show: {
    ready: true
  },
  hide: {
    target: $('#plotly')
  },
  style: {
    classes: 'myqtip'
  }
});
"

ui <- fluidPage(
  useShinyjs(),
  tags$head(
    tags$link(rel = "stylesheet", href = "jquery.qtip.min.css"),
    tags$script(src = "jquery.qtip.min.js"),
    tags$style("
      .myqtip {
        font-size: 15px;
        line-height: 18px;
        background-color: rgba(54,57,64,0.8);
        border-color: rgb(54,57,64);
        color: white;
      }"
    )
  ),

  div(
    id = "tooltiptext", style = "display: none"
  ),
  div(
    style = "position: relative",
    plotlyOutput("plotly"),
    div(id = "hover_info", style = "position: absolute;")
  )

)

server <- function(input, output){
  output[["plotly"]] <- renderPlotly({
    plot_ly(dat, type = "box",
            x = ~variable, y = ~value,
            text = paste0("<b> group: </b>", dat$Group, "<br/>",
                          "<b> sample: </b>", dat$Sample, "<br/>"),
            hoverinfo = "y") %>%
      onRender(addHoverBehavior)
  })

  observeEvent(input[["hovering"]], {
    if(isTRUE(input[["hovering"]])){
      tooltip <- paste0(input[["d_text"]],
                        "<b> value: </b>", formatC(input[["d_y"]]))
      pos <- ifelse(input[["left_pct"]] < 0.5,
                    ifelse(input[["top_pct"]] < 0.5,
                           "top left",
                           "bottom left"),
                    ifelse(input[["top_pct"]] < 0.5,
                           "top right",
                           "bottom right"))
      runjs(
        paste0(
          sprintf(
            "$('#tooltiptext').html('%s');", tooltip
          ),
          sprintf(js_qTip, pos, pos, input[["left_px"]], input[["top_px"]])
        )
      )
    }
  })

}

shinyApp(ui = ui, server = server)
ggplotly
Beware if you use ggplotly. It pertubs the order of the rows of the dataset. Do in this way:
  output[["plotly"]] <- renderPlotly({
    gg <- ggplot(dat, aes(x=variable, y=value, ids=1:nrow(dat))) +
      geom_boxplot()
    ggly <- ggplotly(gg, tooltip = "y")
    ids <- ggly$x$data[[1]]$ids
    ggly$x$data[[1]]$text <-
      with(dat, paste0("<b> group: </b>", Group, "<br/>",
                       "<b> sample: </b>", Sample, "<br/>")[ids]
    ggly %>% onRender(addHoverBehavior)
  })


