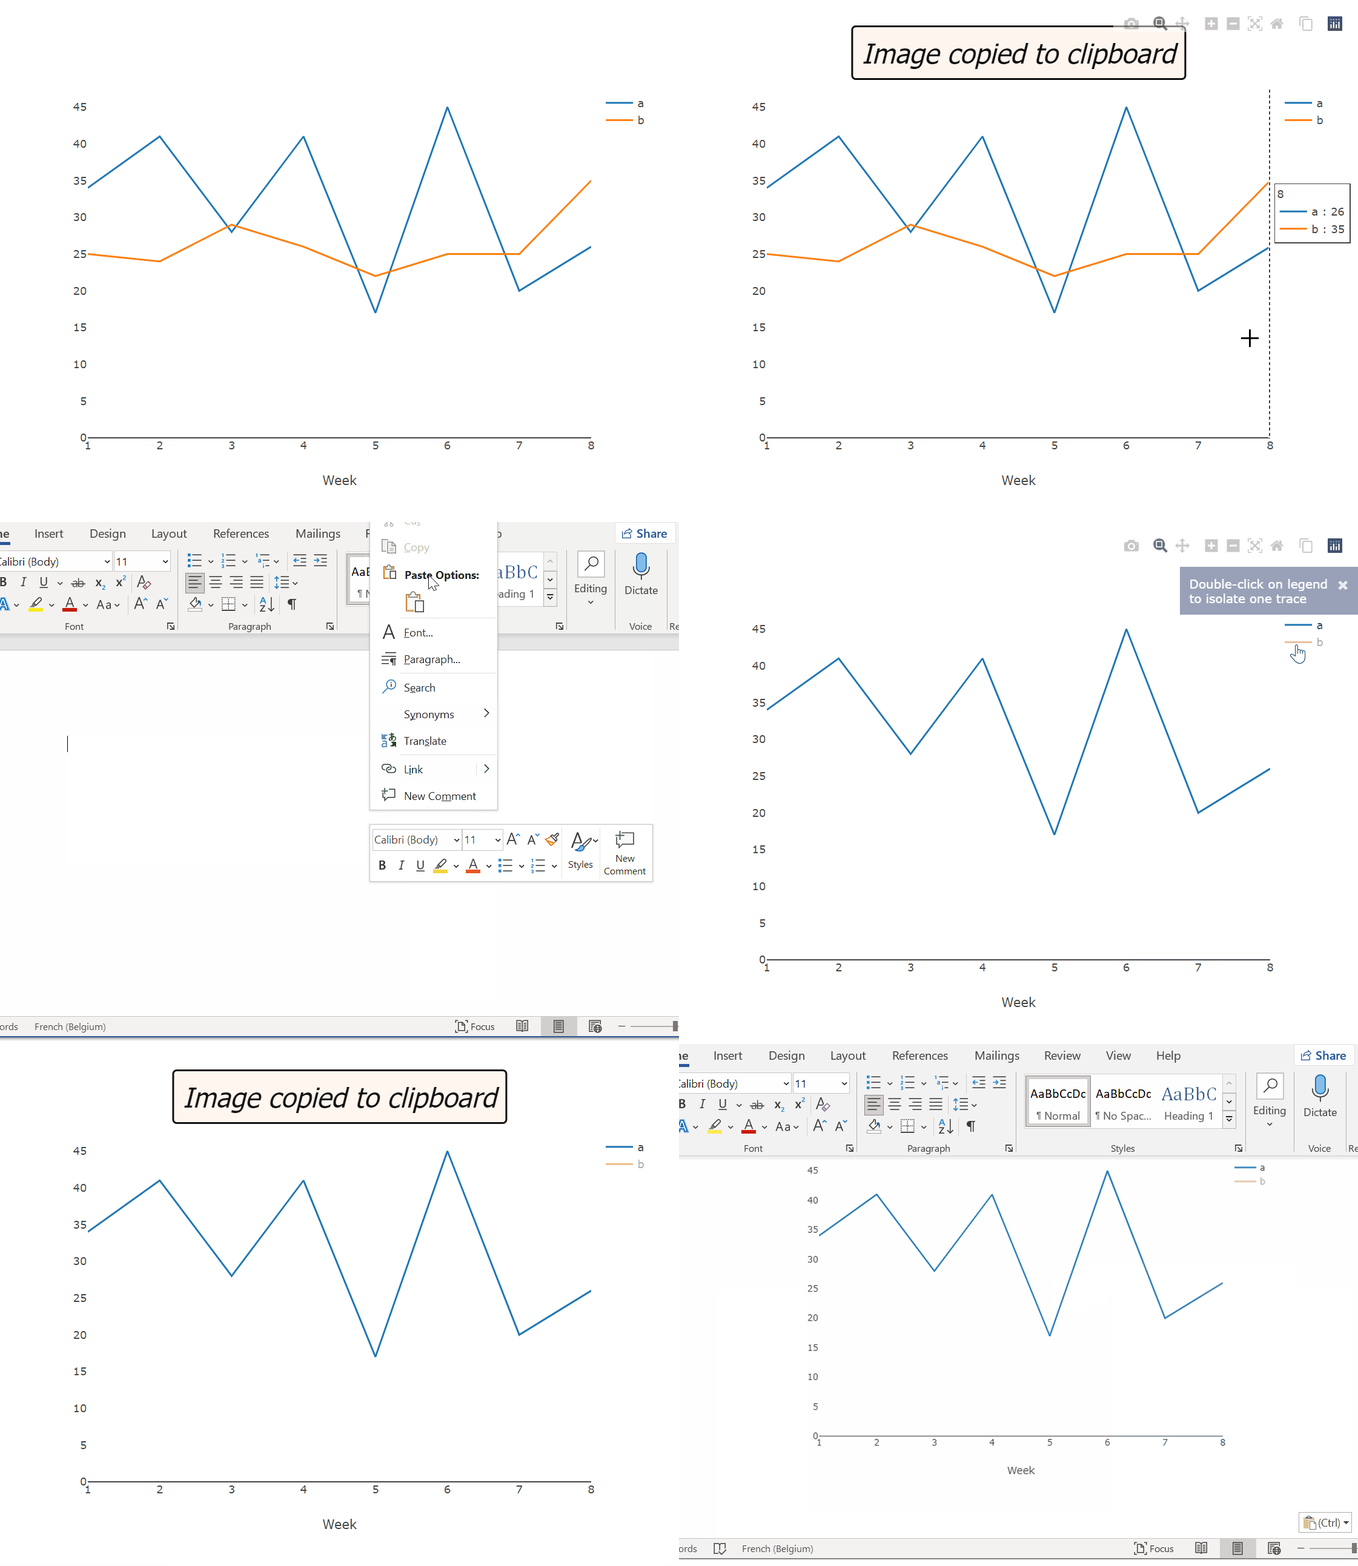
Copy 'plotly' image to the clipboard
Posted on March 16, 2022
by Stéphane Laurent
The R code below shows how to get a “Copy to clipboard” button in the plotly toolbar.
library(plotly)

set.seed(666L)
asd <- data.frame(
  week = c(1, 2, 3, 4, 5, 6, 7, 8),
  a    = rpois(8L, 30),
  b    = rpois(8L, 25)
)

js <- c(
  'function(gd) {',
  '  Plotly.Snapshot.toImage(gd, {format: "png"}).once(',
  '    "success",',
  '    async function(url) {',
  '      try {',
  '        const data = await fetch(url);',
  '        const blob = await data.blob();',
  '        await navigator.clipboard.write([',
  '          new ClipboardItem({',
  '            [blob.type]: blob',
  '          })',
  '        ]);',
  '        console.log("Image copied.");',
  '        var $div = $("<div>Image copied to clipboard</div>");',
  '        $div.css({',
  '          display: "none",',
  '          position: "absolute",',
  '          top: "5%",',
  '          left: "50%",',
  '          transform: "translate(-50%, 0)",',
  '          "font-size": "30px",',
  '          "font-family": "Tahoma, sans-serif",',
  '          "font-style": "italic",',
  '          "background-color": "seashell",',
  '          padding: "10px",',
  '          border: "2px solid black",',
  '          "border-radius": "5px"',
  '        });',
  '        $div.appendTo("body");',
  '        $div.fadeIn(3000, function() {',
  '          $div.fadeOut(3000);',
  '        });',
  '      } catch(err) {',
  '        console.error(err.name, err.message);',
  '      }',
  '    }',
  '  );',
  '}'
)

SVGicon_path <- paste0(
  "M97.67,20.81L97.67,20.81l0.01,0.02c3.7,0.01,7.04,1.51,9.46,3.93c2.4,2.",
  "41,3.9,5.74,3.9,9.42h0.02v0.02v75.28 v0.01h-0.02c-0.01,3.68-1.51,7.03-",
  "3.93,9.46c-2.41,2.4-5.74,3.9-9.42,3.9v0.02h-0.02H38.48h-0.01v-0.02 c-3",
  ".69-0.01-7.04-1.5-9.46-3.93c-2.4-2.41-3.9-5.74-3.91-9.42H25.1c0-25.96,",
  "0-49.34,0-75.3v-0.01h0.02 c0.01-3.69,1.52-7.04,3.94-9.46c2.41-2.4,5.73",
  "-3.9,9.42-3.91v-0.02h0.02C58.22,20.81,77.95,20.81,97.67,20.81L97.67,20",
  ".81z M0.02,75.38L0,13.39v-0.01h0.02c0.01-3.69,1.52-7.04,3.93-9.46c2.41",
  "-2.4,5.74-3.9,9.42-3.91V0h0.02h59.19 c7.69,0,8.9,9.96,0.01,10.16H13.4h",
  "-0.02v-0.02c-0.88,0-1.68,0.37-2.27,0.97c-0.59,0.58-0.96,1.4-0.96,2.27h",
  "0.02v0.01v3.17 c0,19.61,0,39.21,0,58.81C10.17,83.63,0.02,84.09,0.02,75",
  ".38L0.02,75.38z M100.91,109.49V34.2v-0.02h0.02 c0-0.87-0.37-1.68-0.97-",
  "2.27c-0.59-0.58-1.4-0.96-2.28-0.96v0.02h-0.01H38.48h-0.02v-0.02c-0.88,",
  "0-1.68,0.38-2.27,0.97 c-0.59,0.58-0.96,1.4-0.96,2.27h0.02v0.01v75.28v0",
  ".02h-0.02c0,0.88,0.38,1.68,0.97,2.27c0.59,0.59,1.4,0.96,2.27,0.96v-0.0",
  "2h0.01 h59.19h0.02v0.02c0.87,0,1.68-0.38,2.27-0.97c0.59-0.58,0.96-1.4,",
  "0.96-2.27L100.91,109.49L100.91,109.49L100.91,109.49 L100.91,109.49z"
)

CopyToClipboard <- list(
  name = "Copy",
  icon = list(
    path   = SVGicon_path,
    width  = 111,
    height = 123
  ),
  click = htmlwidgets::JS(js)
)

plot_ly(
  asd, x = ~week, y = ~a, name = "a", type = "scatter", mode = "lines"
) %>%
  add_trace(y = ~b, name = "b", mode = "lines") %>%
  layout(
    margin = list(l = 100, r = 100, b = 100, t = 100),
    xaxis = list(
      title     = "Week",
      showgrid  = FALSE,
      rangemode = "normal"
    ),
    yaxis = list(
      title     = "",
      showgrid  = FALSE,
      rangemode = "tozero"
    ),
    hovermode = "x unified"
  ) %>%
  config(modeBarButtonsToAdd = list(CopyToClipboard))


