Volume under surface from points
The problem
Suppose you want to get the volume under a surface but you only have some points on this surface. For the illustration, I will take the surface defined by \(z = \exp\bigl(-(x^2 + y^2)\bigr)\) on the square \([-5, 5] \times [-5, 5]\). Then the volume we’re looking for is close to \(\pi\) (the integral on \([-\infty, +\infty] \times [-\infty, +\infty]\) is exactly \(\pi\)).
f <- function(x, y){
  exp(-(x*x + y*y))
}
Now let’s define a grid on \([-5, 5] \times [-5, 5]\) and the value of \(z\) for each point on this grid:
x <- seq(-5, 5, length.out = 100)
y <- seq(-5, 5, length.out = 100)
grd <- transform( # data (x_i, y_i, z_i)
  expand.grid(x = x, y = y), z = f(x, y)
)
Elevated Delaunay tessellation - using ‘deldir’
A solution consists in constructing a Delaunay tessellation of the surface and then to sum the volumes under the Delaunay triangles. The deldir package allows to construct such a Delaunay tessellation (which I call an elevated Delaunay tessellation).
library(deldir)
del <- deldir( # Delaunay
  x = grd[["x"]], y = grd[["y"]], z = grd[["z"]],
  rw = c(-5, 5, -5, 5), round = FALSE
)
trgls <- triang.list(del) # extracts all triangles
The function below calculates the volume under a triangle:
volume_under_triangle <- function(trgl){
  with(
    trgl,
    sum(z) *
      (x[1L]*y[2L] - x[2L]*y[1L] + x[2L]*y[3L] -
         x[3L]*y[2L] + x[3L]*y[1L] - x[1L]*y[3L]) / 6
  )
}
So here is our approximation of the volume:
volumes <- vapply(trgls, volume_under_triangle, numeric(1L))
sum(volumes)
## [1] 3.141592
Using ‘RCGAL’
If you ran the above code, you noticed that the deldir function as well as the triang.list function are a bit slow. My package RCGAL (not on CRAN) can construct an elevated Delaunay tessellation, and it is faster.
library(RCGAL)
points <- as.matrix(grd)
del <- delaunay(points, elevation = TRUE)
You can directly get the volume:
del[["volume"]]
## [1] 3.141593
And you can easily plot the elevated Delaunay tessellation with the help of the rgl package:
mesh <- del[["mesh"]]
library(rgl)
open3d(windowRect = c(50, 50, 562, 306), zoom = 0.5)
aspect3d(1, 1, 3)
shade3d(mesh, color = "limegreen")
wire3d(mesh)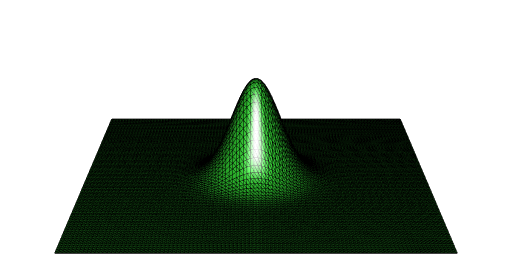
Update 2022-03-02: using ‘tessellation’
The elevated Delaunay tessellation is now available in my package tessellation. The command to get it is the same as the ‘RCGAL’ command and the output is similar.
del <- tessellation::delaunay(points, elevation = TRUE)
del[["volume"]]
## [1] 3.141593
Update 2022-03-10: using ‘RCDT’
The elevated Delaunay triangulation is now available in my package RCDT.
del <- RCDT::delaunay(points, elevation = TRUE)
del[["volume"]]
## [1] 3.141593
Interactive plot with ‘deldir’
The deldir also allows to get an interactive graphic from the elevated Delaunay tessellation. This requires the rgl package. I do it below with a less fine grid, otherwise the visualization is not nice (too dense):
x <- seq(-3, 3, length.out = 20)
y <- seq(-3, 3, length.out = 20)
grd <- transform(
  expand.grid(x = x, y = y), z = f(x, y)
)
del <- deldir(
  x = grd[["x"]], y = grd[["y"]], z = grd[["z"]],
  rw = c(-3, 3, -3, 3), round = FALSE
) library(rgl)
persp3d(del, front = "lines", back = "lines", col = "blue")
aspect3d(2, 2, 1)